![]()
Leaf area index (LAI), defined as the one-sided green leaf area per unit ground surface area (Chen and Black 1992), is a key parameter to predict photosynthesis, evapo-transpiration and growth of vegetation canopies. As canopy reacts more promptly to the other plant components to disturbances, LAI is also frequently used for continuous monitoring of vegetation, being recognized as an Essential Climate Variable (ECV) by the Global Climate Observing System (GCOS).
LAI can be collected in the field, using either direct or indirect optical methods (for a review, see Yan et al. 2019, Chianucci 2020). However, in situ measurements are time-consuming and unpractical for large areas. Proximal and remotely-sensed information offers a unique way to obtain spatially-extensive mapping of LAI, from landscape to the global scale. While active sensors like LiDAR and SAR have recently considered attention for monitoring LAI (Wang et al. 2020), so far the majority of applications consider passive optical sensing (Chianucci et al. 2016; Fang et al. 2019; Xie et al. 2019).
Passive optical methods typically derive LAI from empirical equation relating LAI to some vegetation indices (VIs). The Normalized Difference Vegetation Index (NDVI) is amongst the most widely used VI in vegetation monitoring, as it is simple and can be derived from the widest array of multi-spectral sensors currently available. This theoretically allows for a more consistent retrieval of LAI from passive optical sensing tools, ranging from field spectroradiometer and multi-spectral imagery, up to drone, airborne, and satellite optical imagery. However, the relationship between LAI and NDVI is essentially non-linear, and sensitive to vegetation type (crop-specific), canopy conditions and density. Therefore, many conversion equations have been proposed and published in the literature, deriving from applications in different regions, on different crops, and with different sensors.
Recently, Bajocco et al. 2022 compiled the most comprehensive library of LAI-NDVI conversion formulas by literature screening. The LAIr package provides a simple tool to implement the conversion formulas available in this library. A single function NDVI2LAI() allows to select the most suitable formula(s) by selecting those based on available vegetation and sensor attributes, and apply the conversion equation(s) to raster or numeric inputs. The next paragraphs describe in detail the methodology and the package functioning.
You can install LAIr from CRAN:
You can install the development version of LAIr using devtools (Wickham et al. 2021):
The LAIr package features a single NDVI2LAI function. The function allows to import an input Raster* or numeric vector and select the suitable conversion equation formula(s) based on a set of optional vegetation (biome, category, type, name), or sensor (sensor name, platform, resolution) filtering parameters. If no arguments are not considered, the function by default implement all the available functions.
The list of all available LAI-NDVI equations have been compiled by Bajocco et al. 2022 and can be screened by typing NDVI2LAIeq, which allows to see also the available options for each filtering parameter. Here we showed a selected set of functions and arguments:
#> # A tibble: 6 × 12
#>   Function.ID     F.ID  Plant.Category Plant.Type Plant.Name Location.Biome.Code
#>   <chr>           <chr> <chr>          <chr>      <chr>                    <dbl>
#> 1 Johnson_et_al_… F001  Crop           Permanent  Vineyard                    12
#> 2 Wilson_Meyer_2… F002  Crop           Summer     Maize                        8
#> 3 Fei_et_al_2012  F003  Crop           Summer     Maize                        4
#> 4 Tan_et_al_2020… F004  Crop           Winter     Wheat                        4
#> 5 Tan_et_al_2020… F005  Crop           Winter     Wheat                        4
#> 6 Tan_et_al_2020… F006  Crop           Winter     Wheat                        4
#> # ℹ 6 more variables: Location.Biome <chr>, Location.Country <chr>,
#> #   Sensor.Name <chr>, Sensor.Platform <chr>, Sensor.Resolution <dbl>,
#> #   Sensor.ResolutionClass <chr>
Below we showed two basic examples depending on the input values.
The function returns a dataframe with an ‘input’ column and many columns as the selected number of conversion equations:
NDVI2LAI(seq(0.5,1,.2), category = 'Mixed', sensor = c('PROBA-V', 'SPOT'))
#>   input Verger_et_al_2011 Martinez_et_al_2010
#> 1   0.5          1.093126               2.669
#> 2   0.7          2.208209               4.117
#> 3 0.9 7.282413 5.565The function NDVI2LAI can consider any type of Raster* input (i.e., RasterLayer, RasterBrick or RasterStack). In case of multi-layer images, the computation is performed for each layer.
# generate a raster
set.seed(123)
input <- terra::rast(ncol = 9, nrows = 9, vals = runif(81))
res <- NDVI2LAI(input, category = 'Crop', name = c('Vineyard', 'Barley'), sensor = 'MODIS')
terra::plot(res)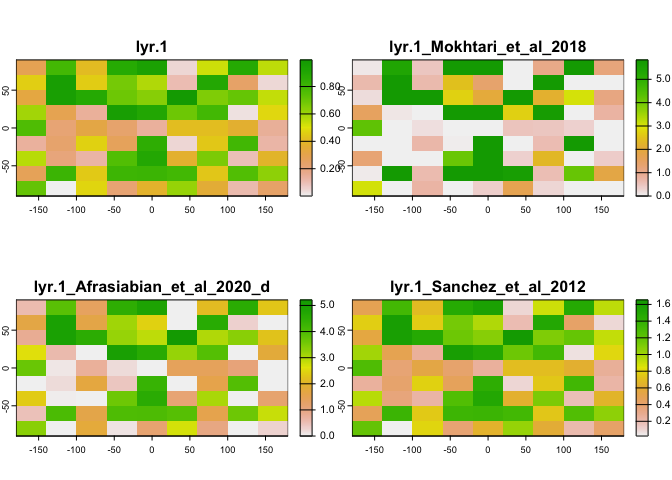
This work has been performed in the framework of GeoMood, an independent researchers collective focusing on agriculture, forest and environment. The package was carried out within the Agritech National Research Center and received funding from the European Union Next-GenerationEU (National Recovery and Resilience Plan (NRRP) – MISSION 4 COMPONENT 2, INVESTMENT 1.4 – D.D. 1032 17/06/2022, CN00000022). This manuscript reflects only the author’s views and opinions, neither the European Union nor the European Commission can be considered responsible for them.
Bajocco, S., Ginaldi, F., Savian, F., Morelli, D., Scaglione, M., Fanchini, D., Raparelli, E. and Bregaglio, S.U.M., 2022. On the use of NDVI to estimate LAI in field crops: Implementing a conversion equation library. Remote Sensing, 14(15), p.3554. https://doi.org/10.3390/rs14153554.
Chen, J.M. and Black, T.A., 1992. Defining leaf area index for non‐flat leaves. Plant, Cell & Environment, 15(4), pp.421-429. https://doi.org/10.1111/j.1365-3040.1992.tb00992.x.
Chianucci, F., Disperati, L., Guzzi, D., Bianchini, D., Nardino, V., Lastri, C., Rindinella, A. and Corona, P., 2016. Estimation of canopy attributes in beech forests using true colour digital images from a small fixed-wing UAV. International journal of applied earth observation and geoinformation, 47, pp.60-68. https://doi.org/10.1016/j.jag.2015.12.005.
Chianucci, F., 2020. An overview of in situ digital canopy photography in forestry. Canadian Journal of Forest Research, 50(3), pp.227-242. https://doi.org/10.1139/cjfr-2019-0055.
Fang, H., Baret, F., Plummer, S. and Schaepman‐Strub, G., 2019. An overview of global leaf area index (LAI): Methods, products, validation, and applications. Reviews of Geophysics, 57(3), pp.739-799. [https://doi.org/10.1029/2018RG000608](https://doi.org/10.1029/2018RG000608.
Wang, Y. and Fang, H., 2020. Estimation of LAI with the LiDAR technology: A review. Remote Sensing, 12(20), p.3457. [https://doi.org/10.3390/rs12203457](https://doi.org/10.3390/rs12203457.
Wickham, H., Hester, J., Chang, W., Bryan, J. (2022). _devtools: Tools to Make Developing R Packages Easier. R package version 2.4.5, https://CRAN.R-project.org/package=devtools.
Xie, X., Li, A., Jin, H., Tan, J., Wang, C., Lei, G., Zhang, Z., Bian, J. and Nan, X., 2019. Assessment of five satellite-derived LAI datasets for GPP estimations through ecosystem models. Science of The Total Environment, 690, pp.1120-1130. https://doi.org/10.1016/j.scitotenv.2019.06.516