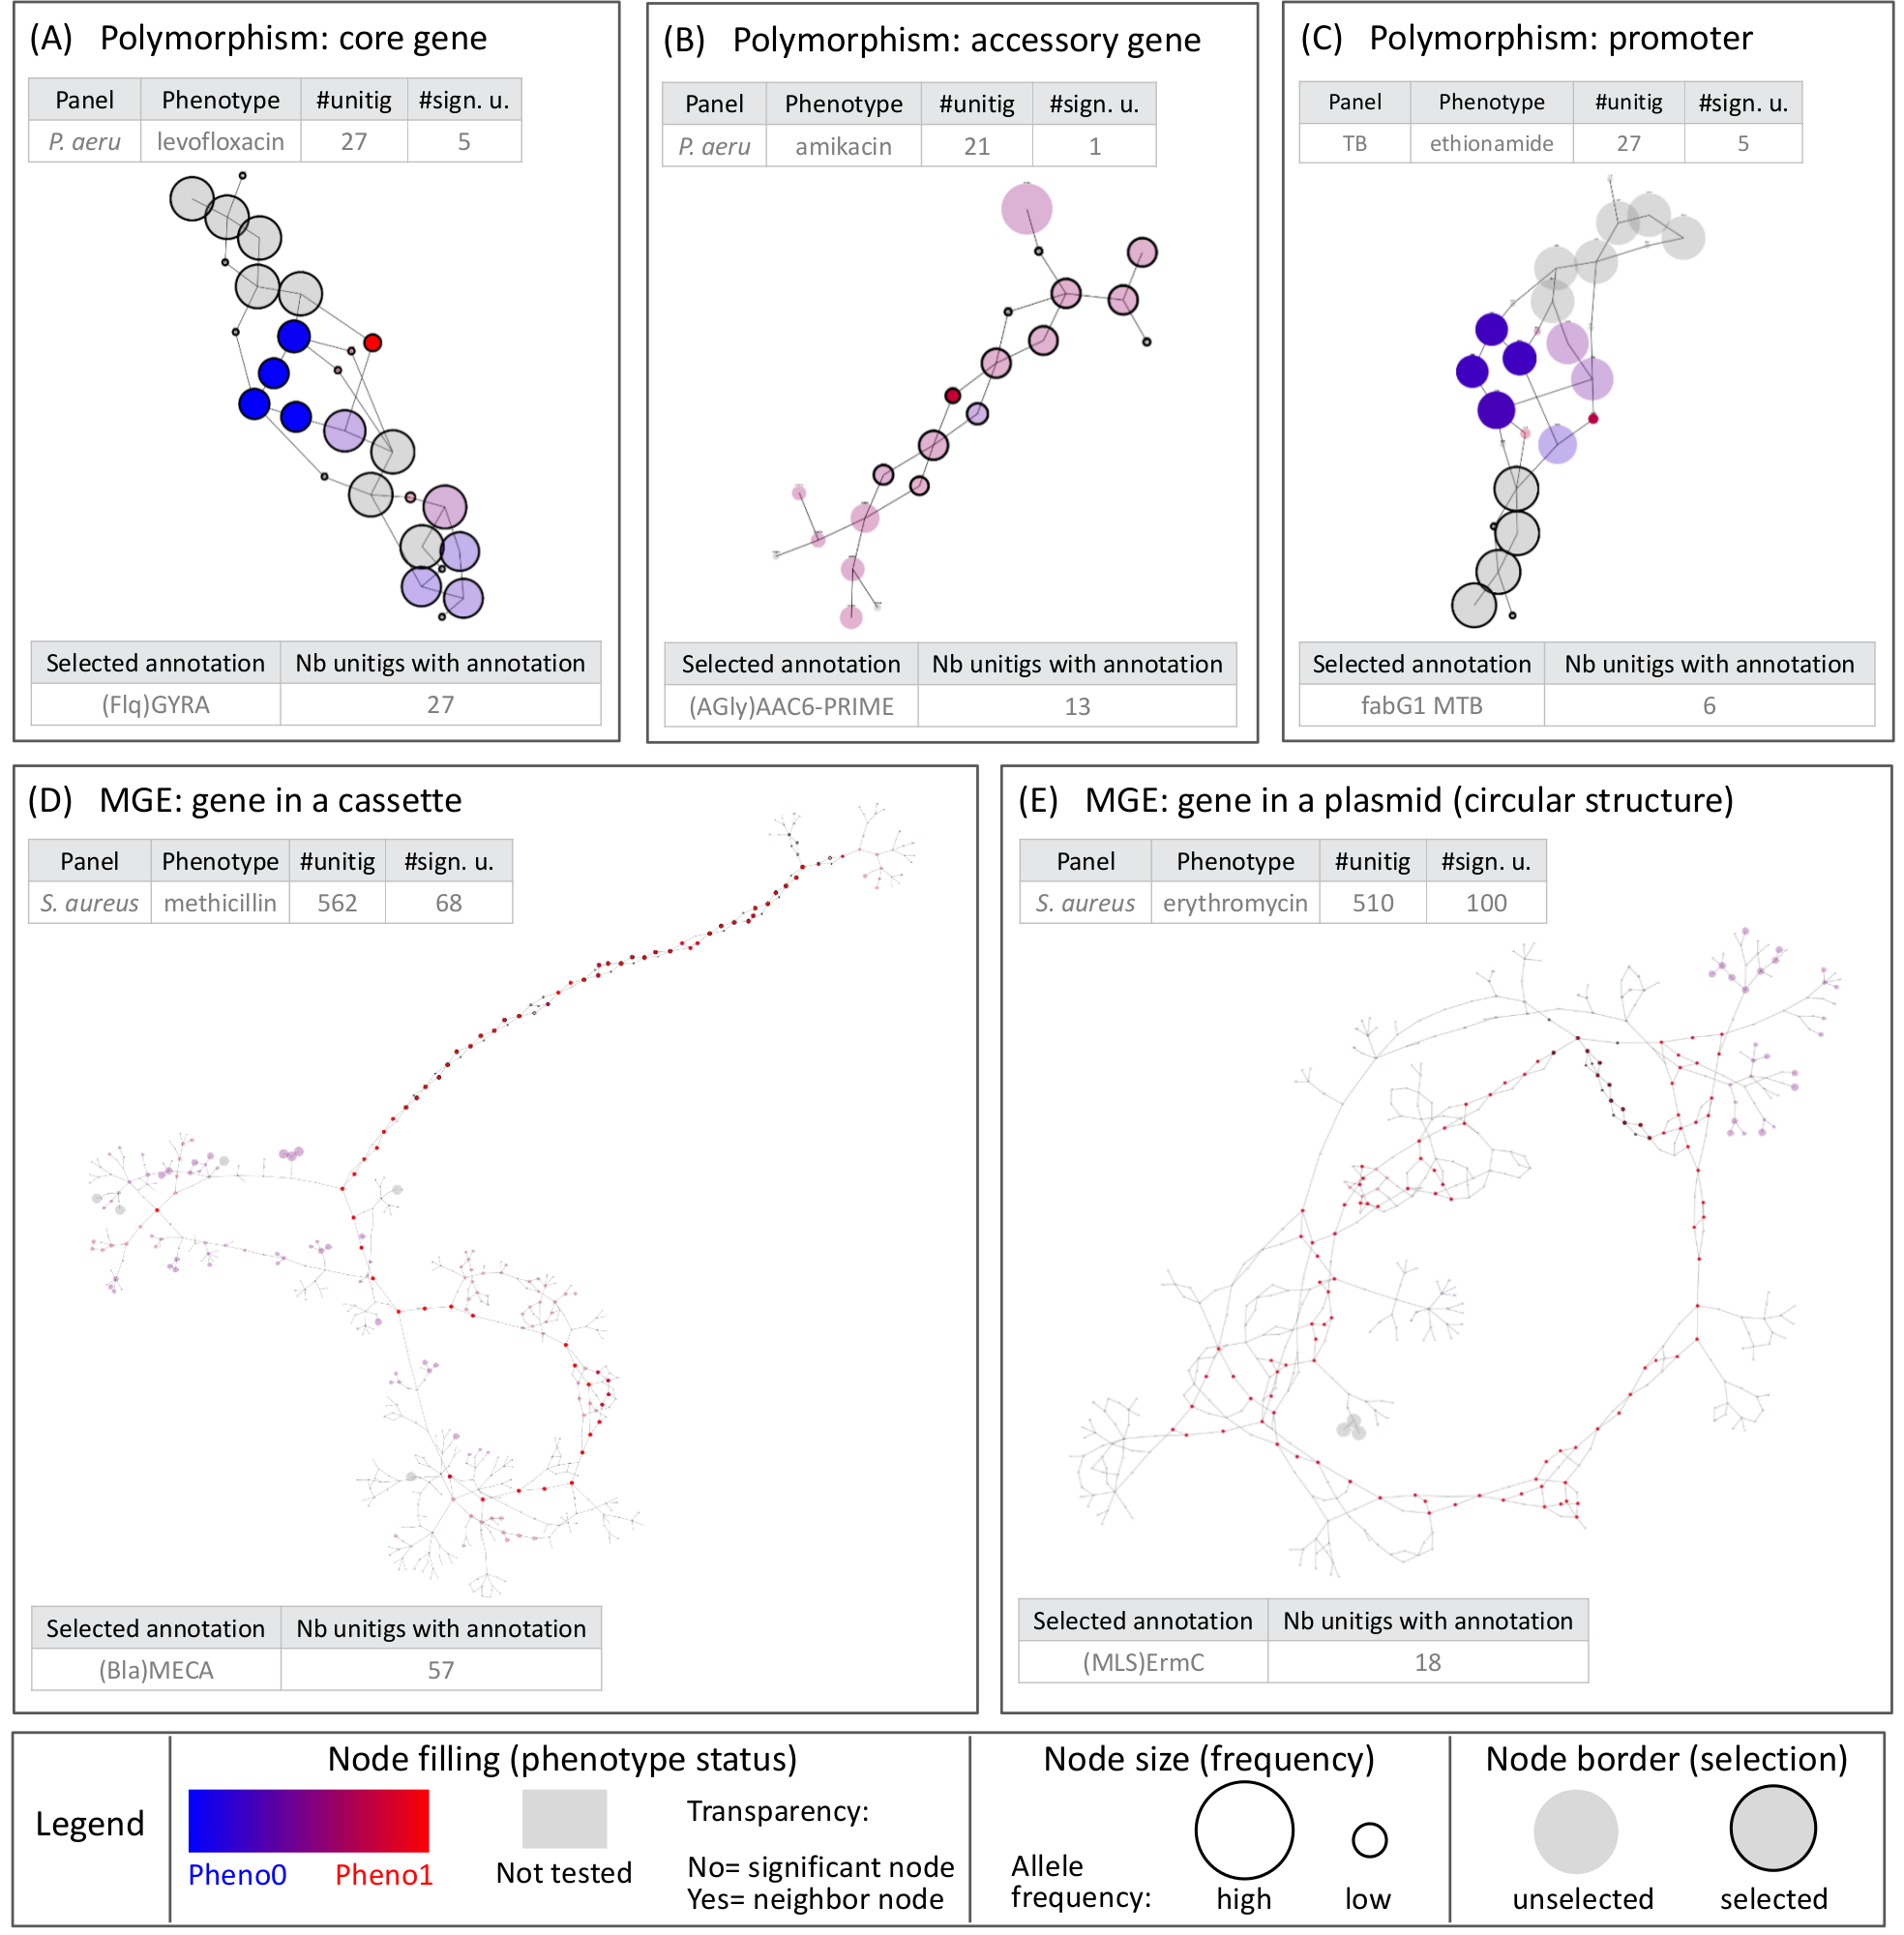
Fig 3. Different types of genetic events identified by DBGWAS. Each subgraph represents a distinct genetic event. Colours are continuously interpolated between blue for susceptible unitigs and red for resistant ones. Untested unitigs, present in > 99% or < 1% of the strains, are shown in grey. Nodes found to be not significative are shown with a transparency degree. The node size relates to its allele frequency: the larger the node, the higher the allele frequency. Circled black nodes map to annotated genes. The two tables in each panel provide information on the sugraph nodes. As an example, the subgraph in panel (A) is composed of 27 unitigs, 5 of which were significantly associated with resistance. All unitigs of this subgraph mapped to the gyrA gene. The subgraphs presented in the four other panels correspond to the top subgraphs (with lowest minq) obtained for different panels/phenotypes. All subgraphs are snapshots taken from DBGWAS interactive visualisation and are available online.