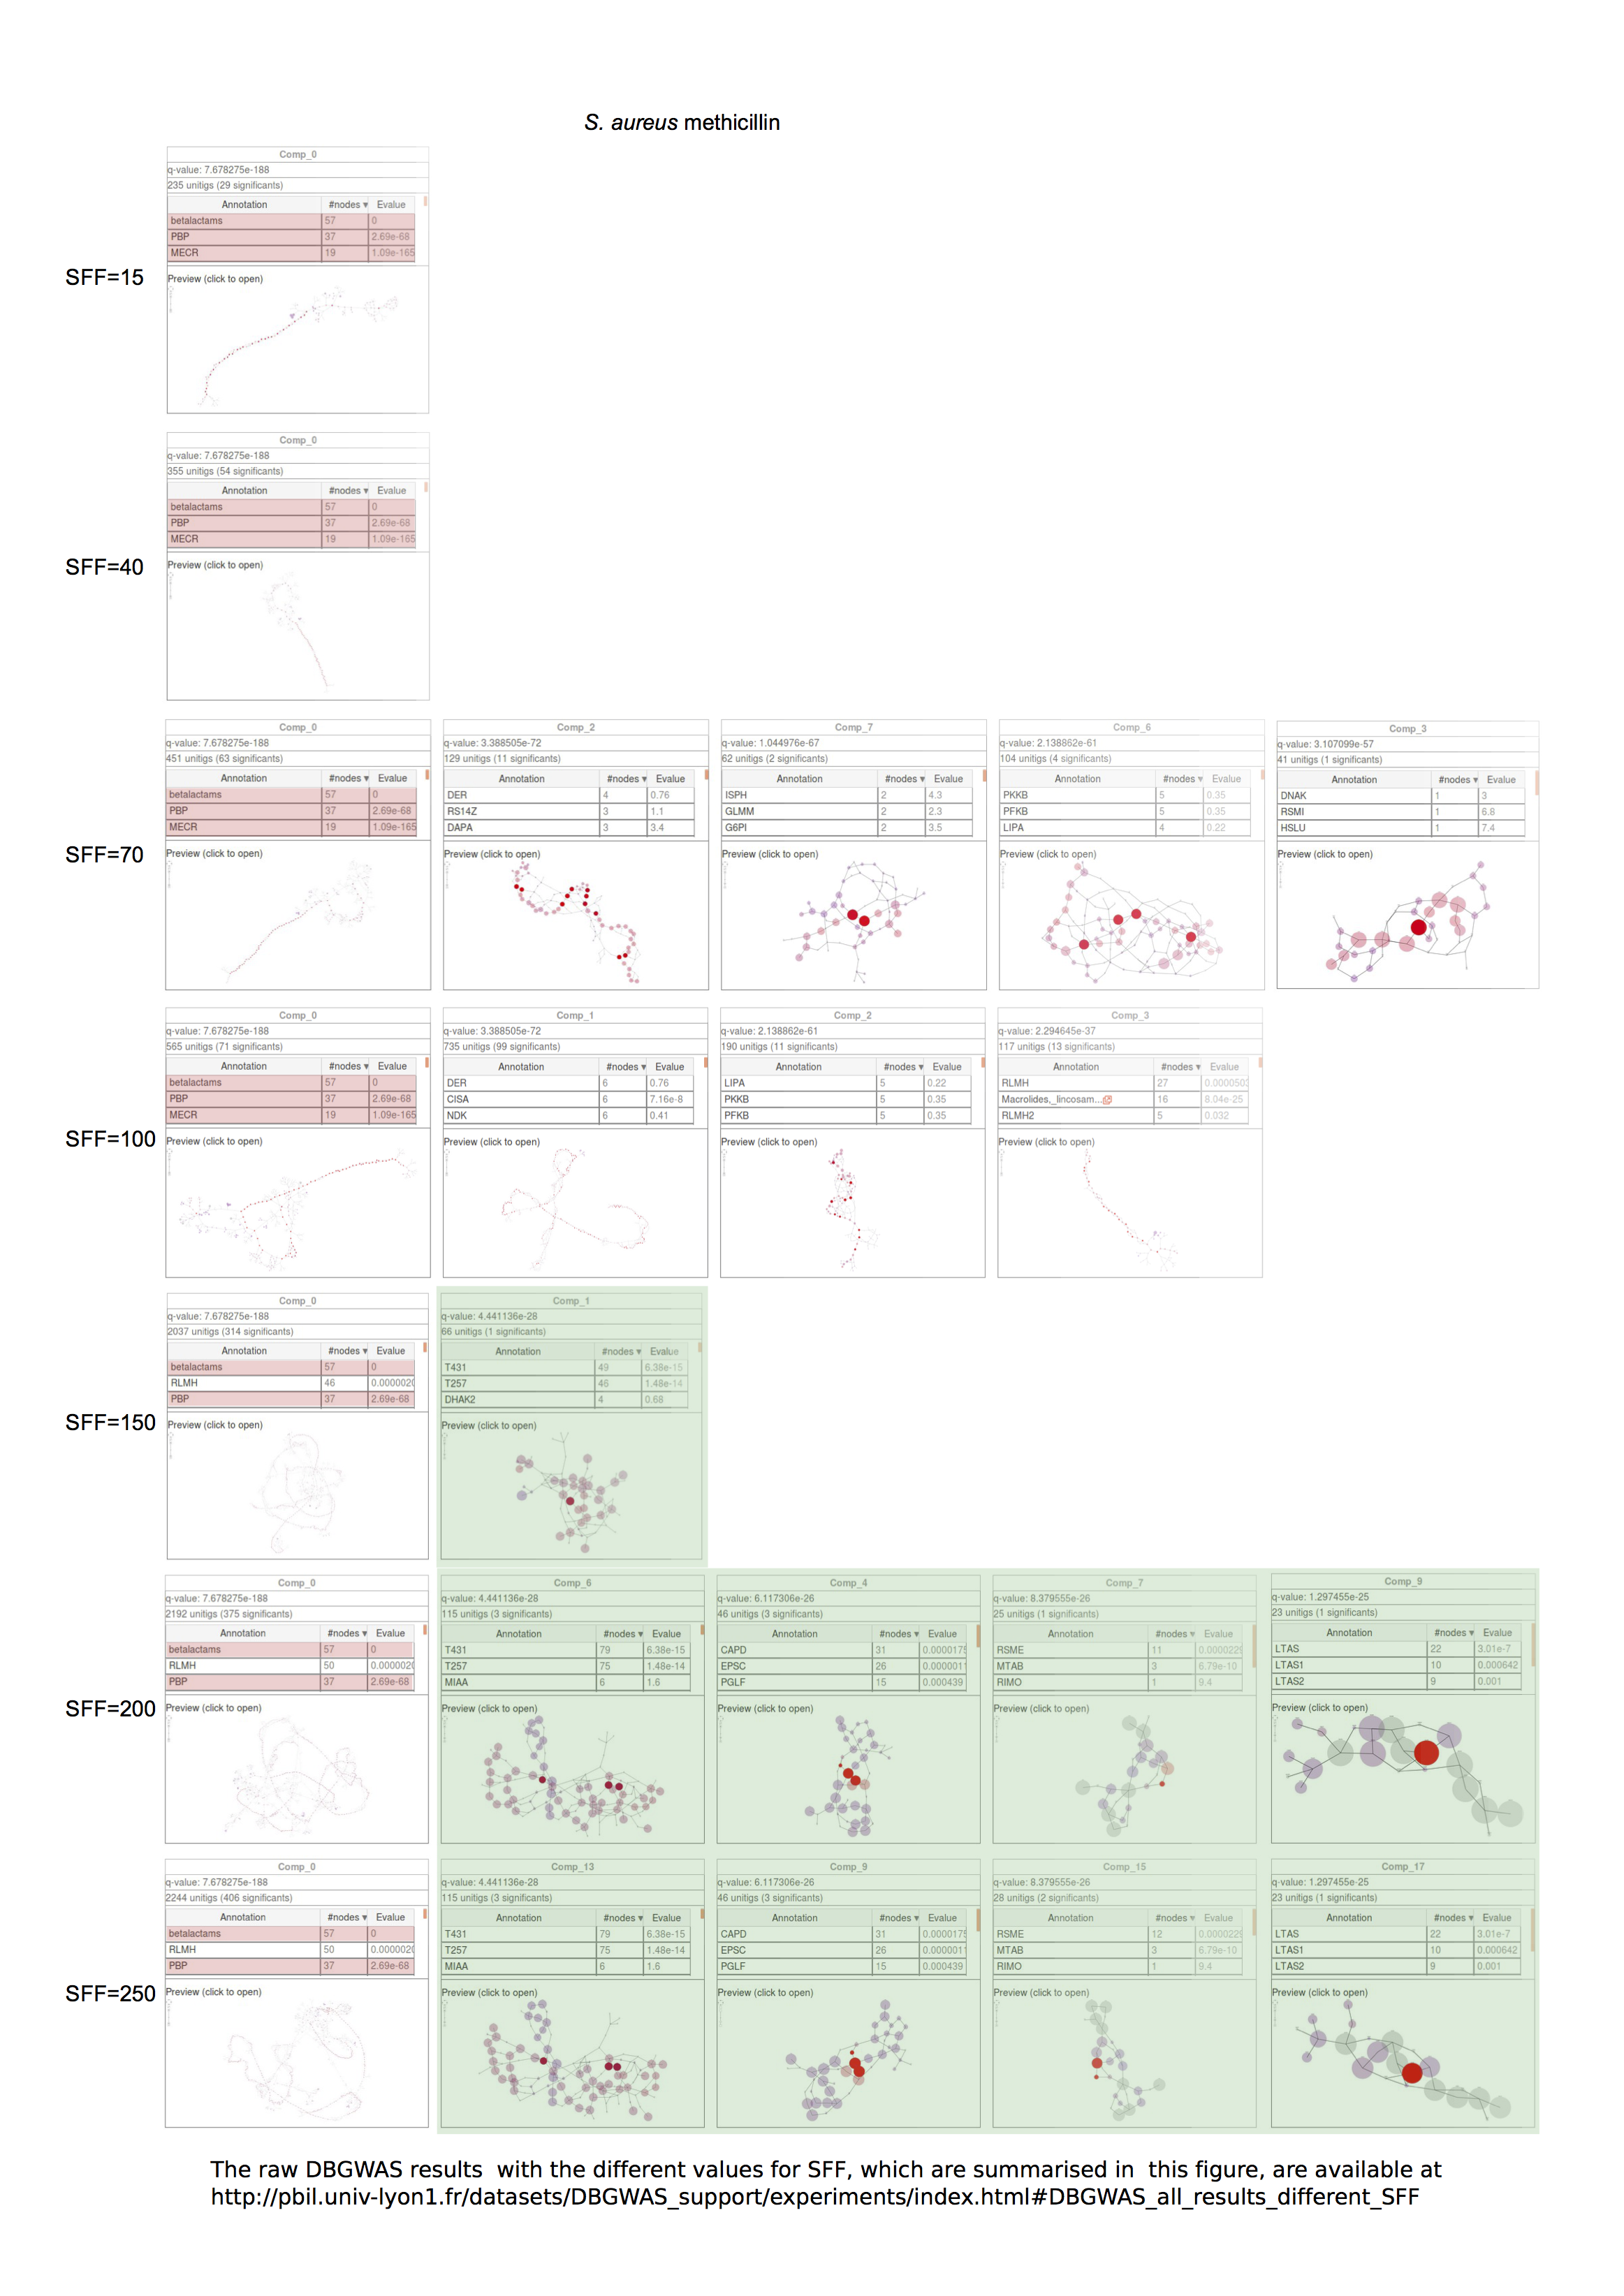
S3 Fig. Effect of SFF on the top subgraphs generated for S. aureus methicillin resistance. Only one subgraph, containing the mecA gene (highlighted in red) is generated for lower SFF values. Then several regions of the SCCmec cassette appear for SFF = 70, and are aggregated into a single subgraph for SFF >= 150. Green subgraphs do not concern the mecA MGE.