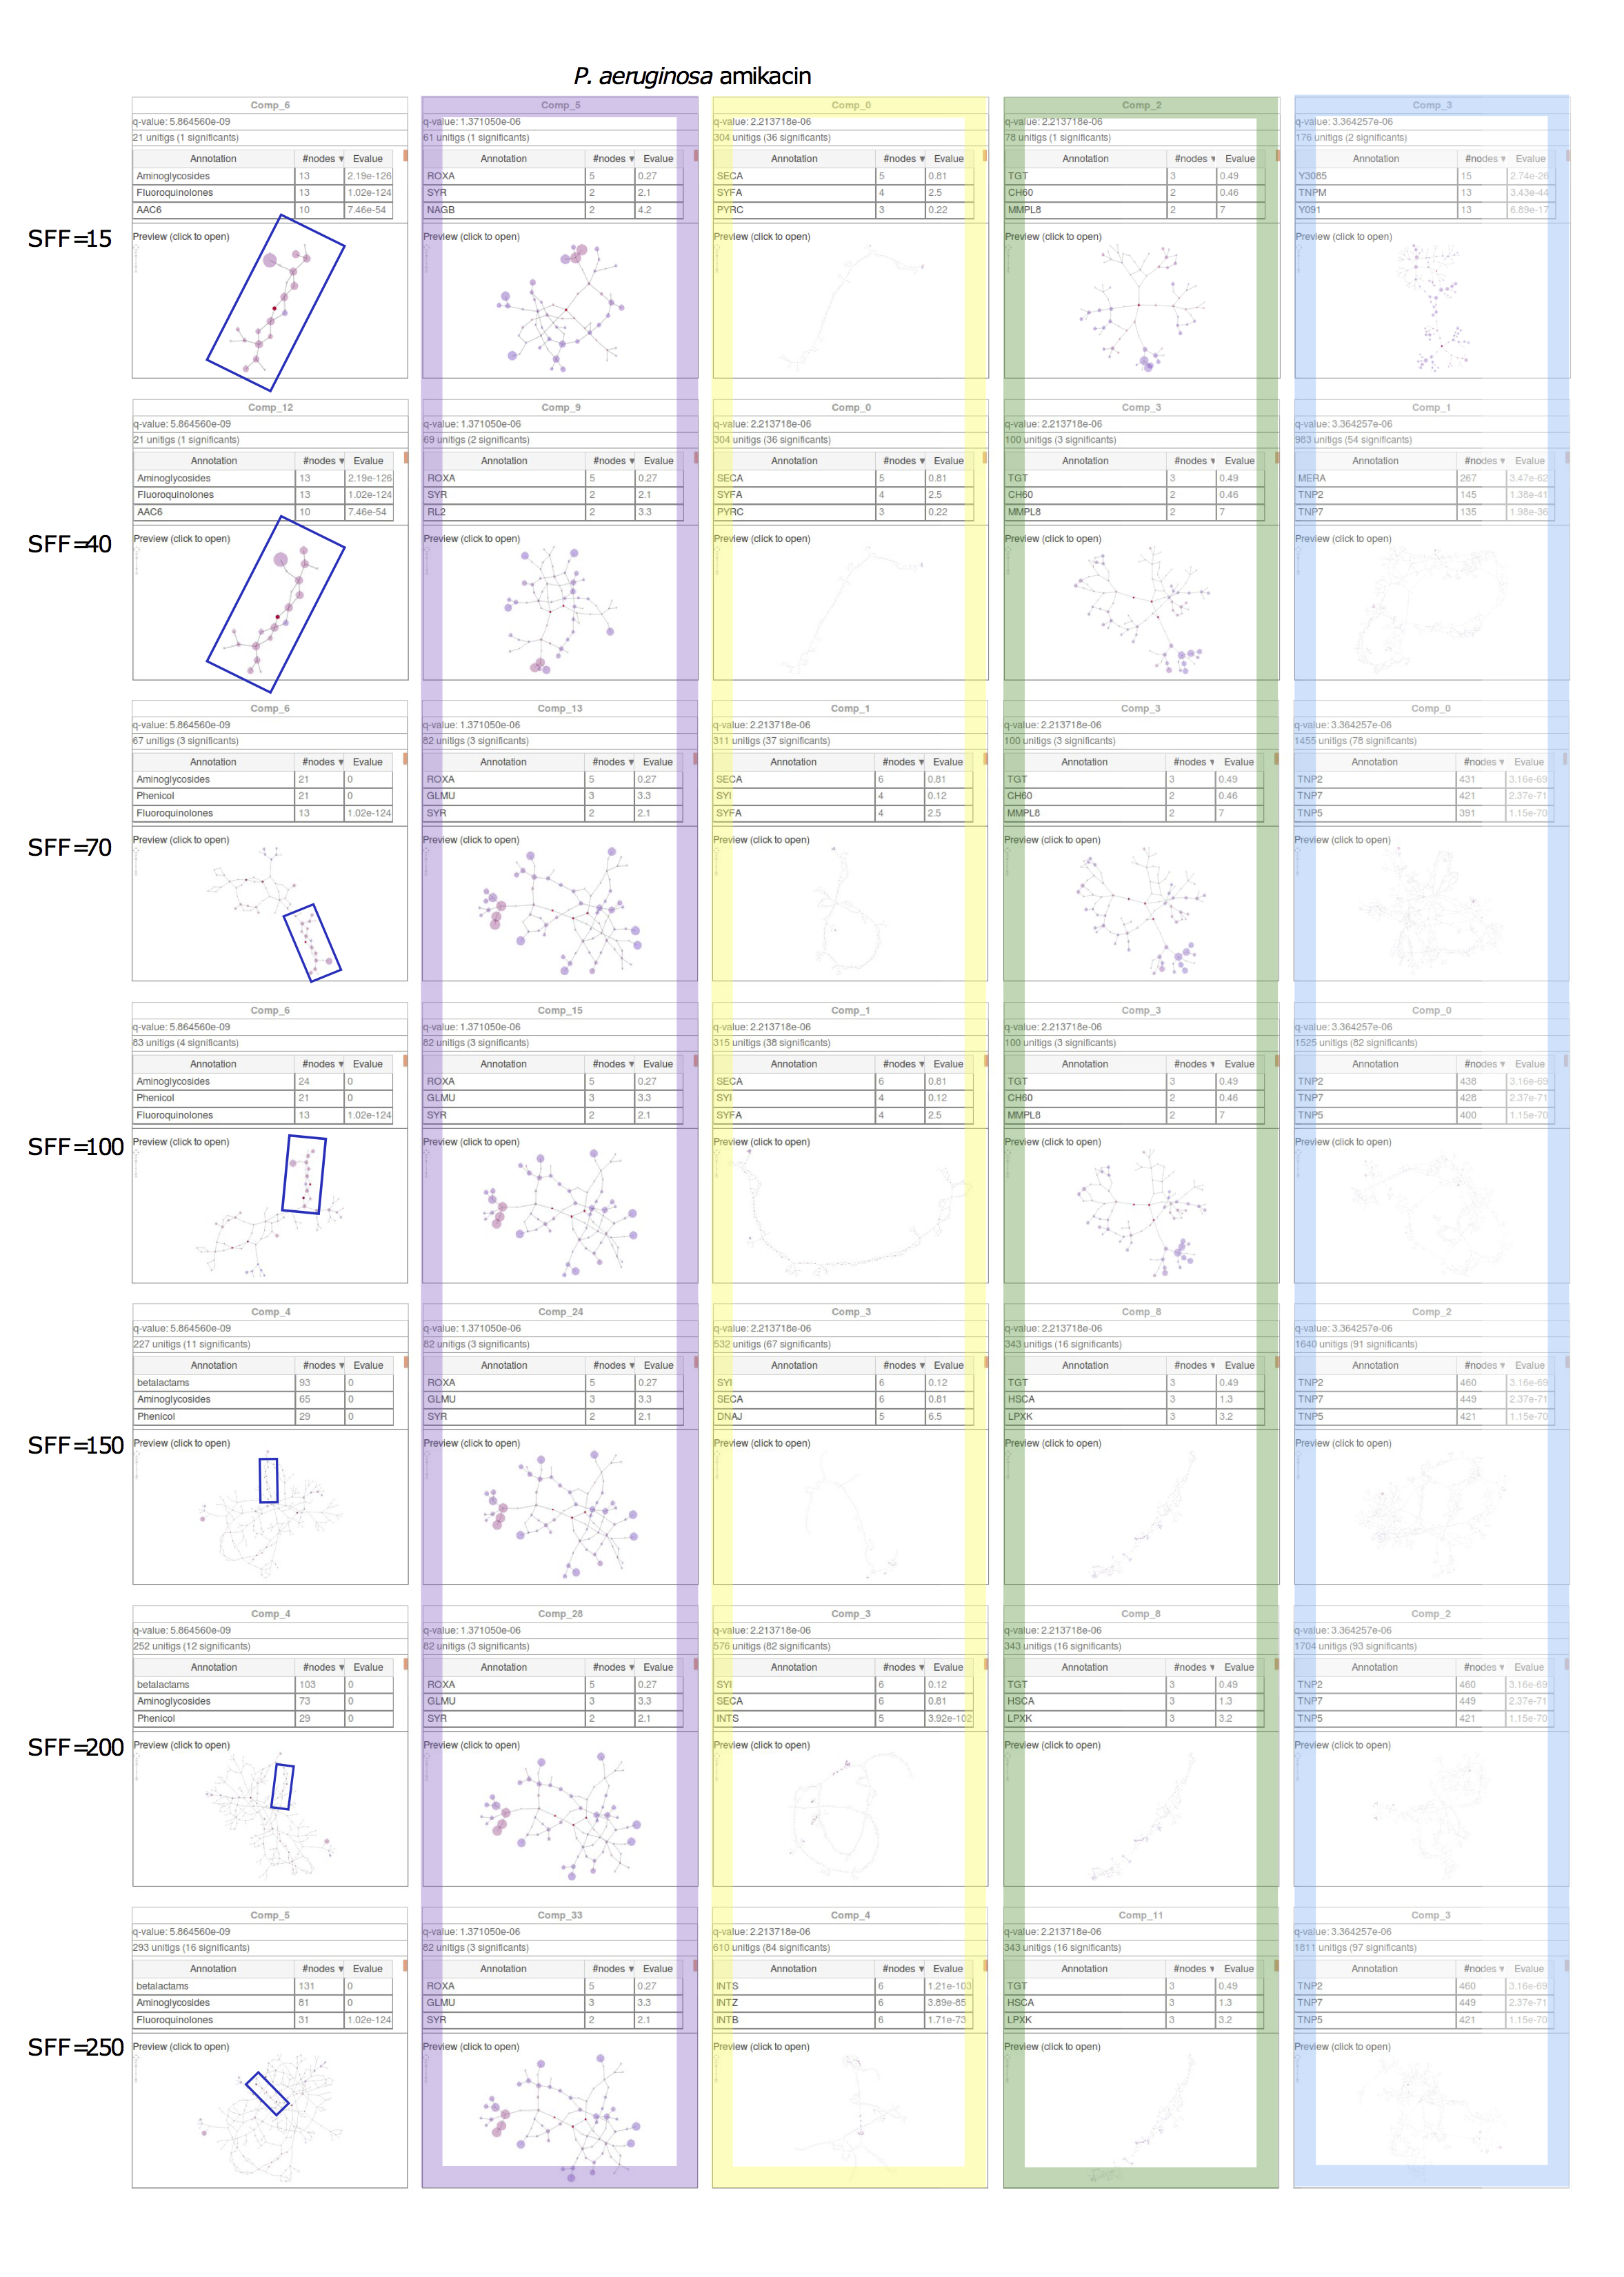
S6 Fig. Effect of SFF on the top subgraphs generated for P. aeruginosa amikacin resistance. Nodes corresponding to aac(6') gene are shown in a blue frame. When the SFF parameter increases, these nodes aggregate to others genes found at least once close to aac(6'). The annotation of the following subgraphs are well conserved (same color legend as in S8 Fig).