Rearranged Oriloc output example: Previous Index Next
Bacteria; Proteobacteria; Deltaproteobacteria; Desulfobacterales; Desulfobulbaceae; Desulfotalea.
Genome size (bp): 3523383
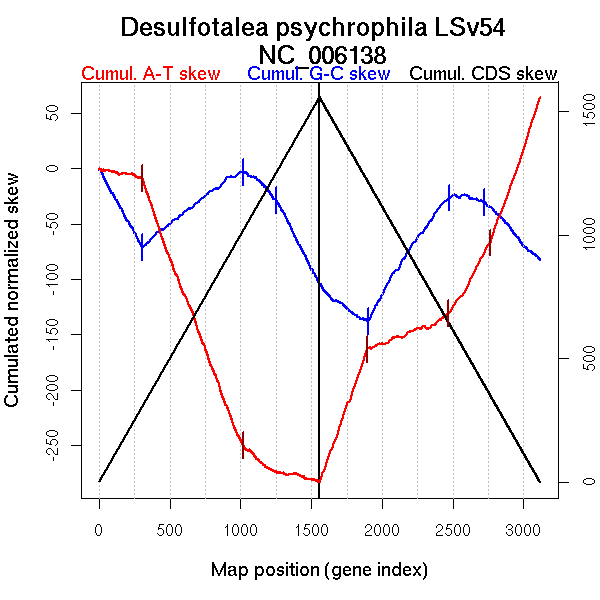
Number of genes 3116
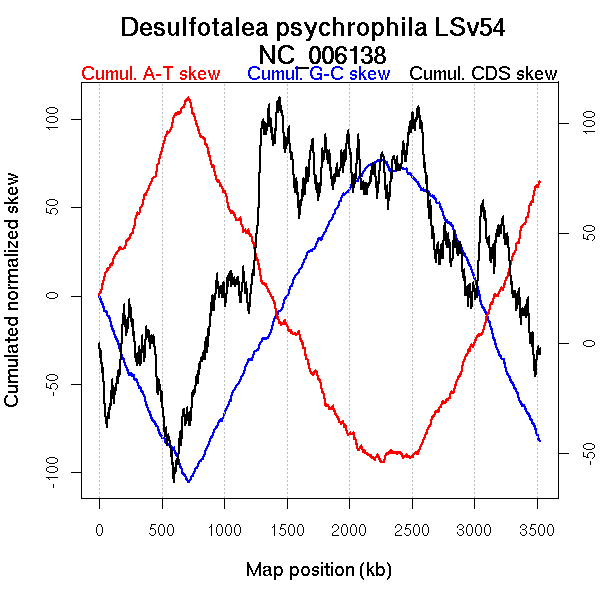
Oriloc predictions: Origin 709 kb Terminus 2260 kb
Worning et al., 2006: Origin 710 kb Terminus 2476 kb
Position of the first peak in DnaA box distribution (Mackiewicz et al., 2004): 709.722 kb
Position(s) of the dnaA gene(s) (Mackiewicz et al., 2004): 302.57 kb
Consensus predictions: Origin 709 kb Terminus 2260 kb
Significant breakpoints (p-value <0.05):
| Breakpoints | P-value | Chromosome coordinate (kb) | |
| GC-skew forward | 307 | 0 | 711 |
| 1018 | 0 | 2233 | |
| 1253 | 0.01333 | 2817 | |
| GC-skew reverse | 1901 | 0 | 719 |
| 2476 | 0 | 2166 | |
| 2719 | 0.00444 | 2708 | |
| AT-skew forward | 305 | 0 | 702 |
| 1016 | 0 | 2228 | |
| AT-skew reverse | 1895 | 0 | 707 |
| 2468 | 0 | 2132 | |
| 2763 | 0.00222 | 2802 |
| From (index/coord) | To (index/coord) | Strand | Slope | |
| GC-skew forward | 1 (0 kb) | 307 (711.083 kb) | lagging | -0.231 |
| 308 (713.589 kb) | 1018 (2232.6825 kb) | leading | 0.097 | |
| 1019 (2234.514 kb) | 1253 (2817.2865 kb) | lagging | -0.112 | |
| 1254 (2822.8175 kb) | 1557 (3523.092 kb) | lagging | -0.251 | |
| GC-skew reverse | 1558 (0 kb) | 1901 (718.9925 kb) | lagging | -0.094 |
| 1902 (719.795 kb) | 2476 (2166.3905 kb) | leading | 0.194 | |
| 2477 (2167.4695 kb) | 2719 (2707.699 kb) | lagging | -0.022 | |
| 2720 (2708.2195 kb) | 3116 (3523.092 kb) | lagging | -0.14 | |
| AT-skew forward | 1 (0 kb) | 305 (702.146 kb) | lagging | -0.024 |
| 306 (706.3935 kb) | 1016 (2228.0955 kb) | leading | -0.338 | |
| 1017 (2229.0175 kb) | 1557 (3523.092 kb) | lagging | -0.053 | |
| AT-skew reverse | 1558 (0 kb) | 1895 (707.0055 kb) | lagging | 0.354 |
| 1896 (707.5455 kb) | 2468 (2132.4265 kb) | leading | 0.052 | |
| 2469 (2135.0975 kb) | 2763 (2802.347 kb) | lagging | 0.225 | |
| 2764 (2804.1815 kb) | 3116 (3523.092 kb) | lagging | 0.37 |
More G than C on the leading strand for replication.