Abstract:
It has been suggested that the synonymous codon usage of human tissue specific genes was under selective pressure
to modulate the expression of proteins by codon-mediated translational control (Plotkin et al 2004 Proc. Natl.
Acad. Sci. 101:12588-12591). To test this model, we analysed by internal correspondence analysis the codon
usage of 2,126 human tissue-specific genes, expressed in 18 different tissues. We confirm that synonymous
codon usage differs significantly between the tissues. However, the effect is very weak: the variability of
synonymous codon-usage between tissues represents only 2.3% of the total codon usage variability. Moreover,
this variability is directly linked to isochore-scale (>100 kb) variability of GC-content, that affect
both coding and introns or intergenic regions. This demonstrates that variations of syonymous codon usage
between tissue-specific genes expressed in different tissues are due to regional variations of substitution
patterns and not to translational selection.
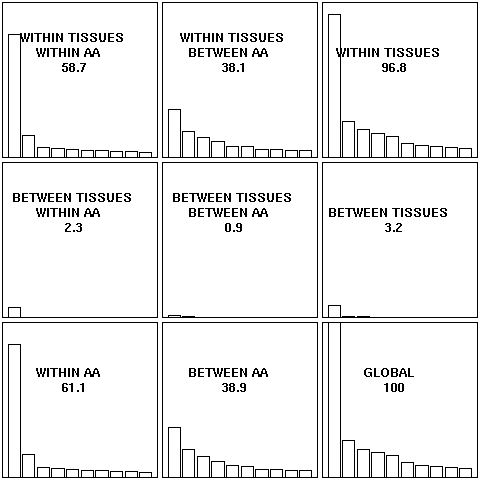
Figure 1.
Contribution to the global codon usage variability of synonymous,
non-synonymous, between tissues and within tissues effects.
Eigenvalue graphs for internal correspondance analysis and associated analyses of codon usage in 2,126 human
coding sequences representing tissue-specific genes from 18 tissues. The eigenvalue for a given factor is
proportional to the variance in the table under analysis that is accounted for by that factor.
The contribution to the total variance of a peculiar analysis is indicated in plain letters.
All the graphs are on the same scale (only the first 10 eigenvalues are represented) to allow
a direct visual comparison. These analyses are additives, as for example the variability explained by the analysis between plus within tissues equals the variability of the global analysis. The part of global
variability due to synonymous codon usage is much more important than the part explained by non-synonymous
codon usage. The part explained by the difference of codon usage within tissues is much more important than
the part explained by the difference between tissues.
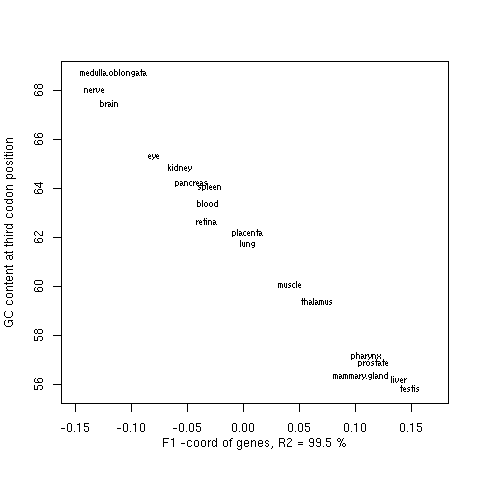
Figure 2.
Average GC-content at the third position of coding sequences, and the positions on the first axis of the
factorial map for synonymous codon usage variability between tissues (their names are indicated). The
correlation is almost perfect (R2=99%). The most important factor (82.5 % of total variability for this
analysis) for synonymous codon usage between tissues is therefore the difference of average GC3-content of
genes between tissues.
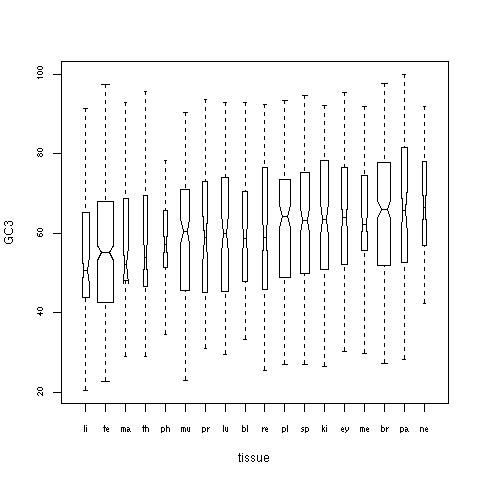
Figure 3.
Relationship between GC-content at third position for genes specifically expressed in 18 tissues. For each
tissue, the distribution of GC-content is represented by a boxplot : the lower, middle and top horizontal
lines of the boxes represent the 25%, 50% and 75% quantiles, respectively. The notches in the boxes represent
a confidence interval (alpha = 5%) for the median. The GC-content at third codon positions is different between
the tissues (because of the large number of points in the dataset the anova is extremely efficient at rejecting the null hypothesis yielding a vanishing small p-value of 10-14), but this should be put in the context of the huge variability of GC-content within tissues, depicted here by the vertical size of the boxes.
Initials of the names of tissues are indicated:
"li":liver,
"te":testis,
"ma":mammary.gland,
"th":thalamus,
"ph":pharynx,
"mu":muscle,
"pr":prostate,
"lu":lung,
"bl":blood,
"re":retina,
"pl":placenta,
"sp":spleen,
"ki":kidney,
"ey":eye,
"me":medulla.oblongata,
"br":brain,
"pa":pancreas,
"ne":nerve
This allows for the on-line reproduction of the figures obtained with SAGE data
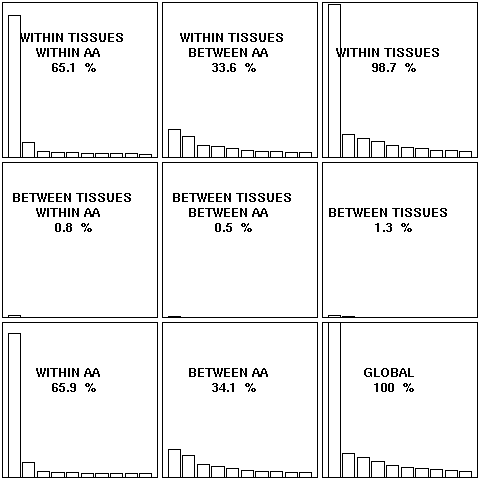
Figure 4.
Contribution to the global codon usage variability of synonymous,
non-synonymous, between tissues and within tissues effects (SAGE data)
Eigenvalue graphs for internal correspondance analysis and associated analyses of codon usage in 1,190 human
coding sequences representing tissue-specific genes from 12 tissues. The eigenvalue for a given factor is
proportional to the variance in the table under analysis that is accounted for by that factor.
The contribution to the total variance of a peculiar analysis is indicated in plain letters.
All the graphs are on the same scale (only the first 10 eigenvalues are represented) to allow
a direct visual comparison. These analyses are additives, as for example the variability explained by the analysis between plus within tissues equals the variability of the global analysis. The part of global
variability due to synonymous codon usage is much more important than the part explained by non-synonymous
codon usage. The part explained by the difference of codon usage within tissues is much more important than
the part explained by the difference between tissues.
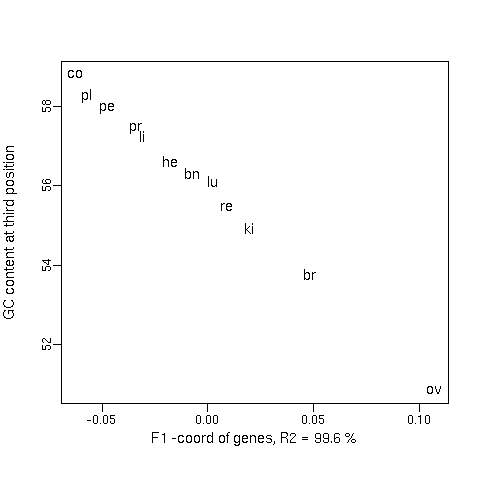
Figure 2.
Average GC-content at the third position of 1190 coding sequences, and the positions on the first axis of the
factorial map for synonymous codon usage variability between tissues (SAGE data, their names are indicated). The
correlation is almost perfect (R2=99%). The most important factor (67.5 % of total variability for this
analysis) for synonymous codon usage between tissues is therefore the difference of average GC3-content of
genes between tissues.
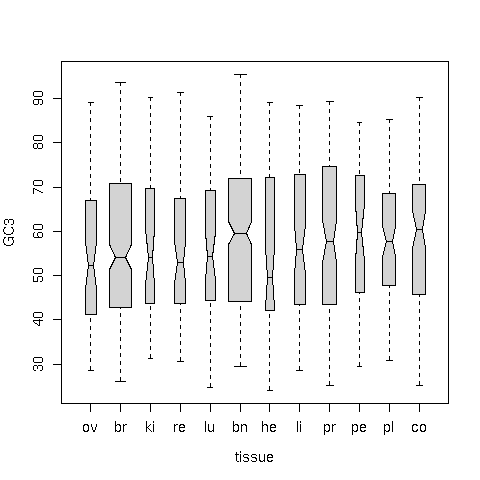
Figure 6.
Relationship between GC-content at third position for 1190 genes specifically expressed in 12 tissues (SAGE data). For each
tissue, the distribution of GC-content is represented by a boxplot : the lower, middle and top horizontal
lines of the boxes represent the 25%, 50% and 75% quantiles, respectively. The notches in the boxes represent
a confidence interval (alpha = 5%) for the median. The GC-content at third codon positions is different between
the tissues (p-value 0.04).
Initials of the names of tissues are indicated:
"ov":ovary,
"he":heart,
"lu":lung,
"re":retina,
"br":breast,
"ki":kidney,
"li":liver,
"pl":placenta,
"bn":brain,
"pe":peritoneum,
"co":colon,
"pr":prostate