Laboratoire BBE CNRS UMR 5558
INRIA Helix Project,
Univ. C. Bernard - LYON I
43 Bd 11/11/1918, F-69622 VILLEURBANNE CEDEX, FRANCE
Abstract:
We have investigated the hypothesis that pyrimidine dinucleotides are
avoided in light-exposed genomes, as the result of selective pressure
due to high UV exposure. The main damage to DNA produced by UV
radiation is known to be the formation of pyrimidine photoproducts: it
is estimated that about ten dimers per minute are formed in an
Escherichia coli chromosome exposed to the ultraviolet light
in direct overhead sunlight at sea level. It is also known that on an
Escherichia coli chromosome exposed to UVb wavelengths (290 to
320 nm), pyrimidine photoproducts are formed in the following
proportions: 59% TpT, 7% CpC, and 34% CpT plus TpC. We have analyzed
all available complete prokaryotic genomes and the model organism
Prochlorococcus marinus, and have found that pyrimidine
dinucleotides are not systematically avoided. This suggests that
prokaryotes must have sufficiently effective protection and repair
systems for UV exposure not to affect their dinucleotide composition.
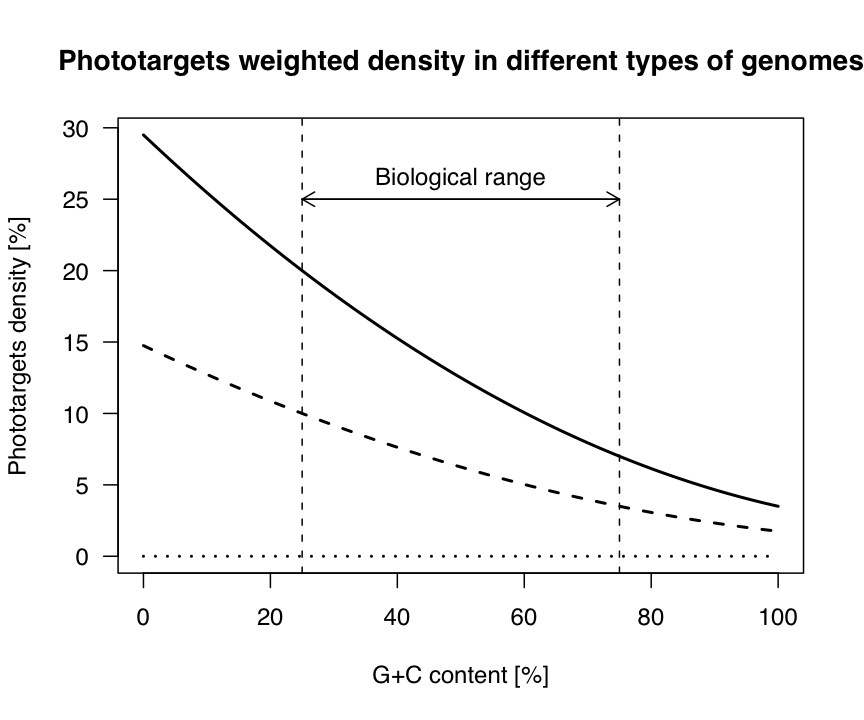
Figure 1 -- Density of phototargets, weighted by their
frequency in the E. coli chromosome, and calculated for
different G+C contents and for three kinds of random genomes. The
weights are as follows:
0.59*f(tt)+0.34*[f(tc)+f(ct)]+0.07*f(cc) (where f(xy)
is the frequency of dinucleotide xy in the specified genome).
Three models of random genomes are analyzed. In the worst case
(solid curve), the genome is the concatenation of a sequence of
pyrimidines and a sequence of purines: all pyrimidines are involved
in a pyrimidine dinucleotide. In the best case (dotted curve), the
genome is an unbroken succession of pyrimidine-purine dinucleotides:
no pyrimidine is involved in a pyrimidine dinucleotide. In the
"random case" (dashed curve), the frequency of a pyrimidine
dinucleotide is the result of chance (f(xy) = f(x)*f(y)).
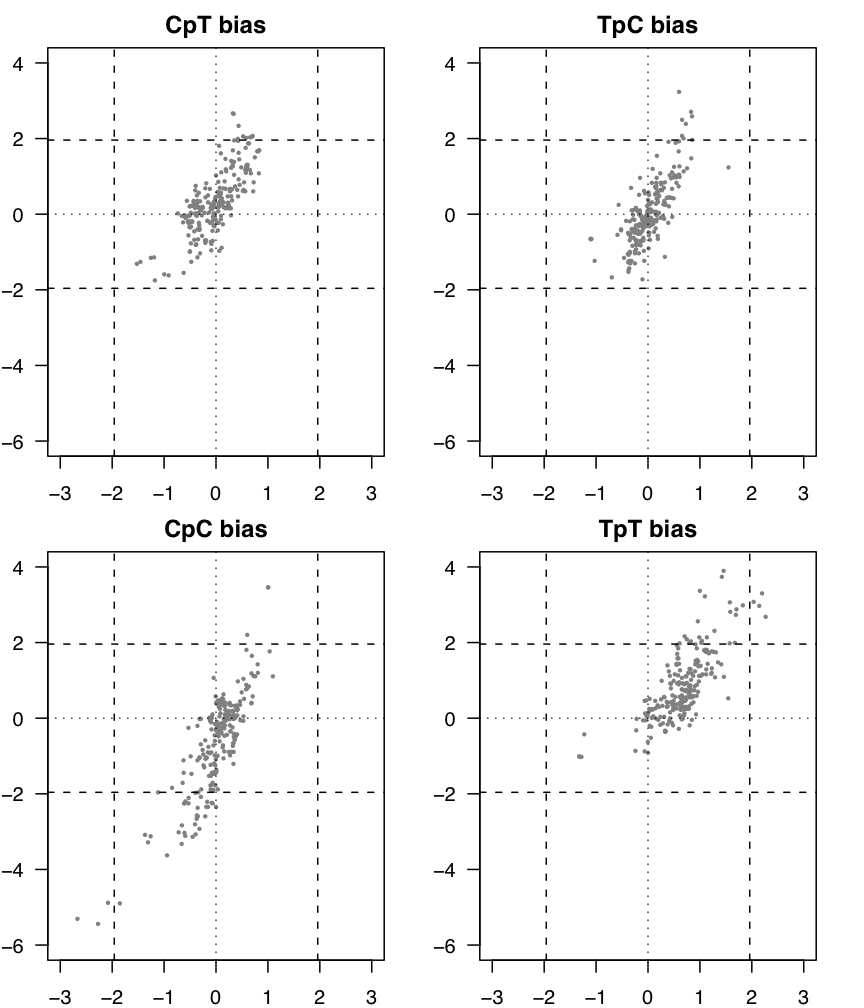
Figure 2 -- Plot of the mean z-score statistics for
intergenic sequences (x-axis) and for coding
sequences (y-axis), for each of the four pyrimidine
dinucleotides. On each plot, a dot corresponds to the mean of these
two statistics in a given prokaryote chromosome. The null x and y
axis (dotted lines), and the 5% limits of significance for the
standard normal distribution (dashed lines) are plotted as
benchmarks. It should be noted note (see Fig 3), that the
variability within one chromosome is sometimes as great as that
between different chromosomes.
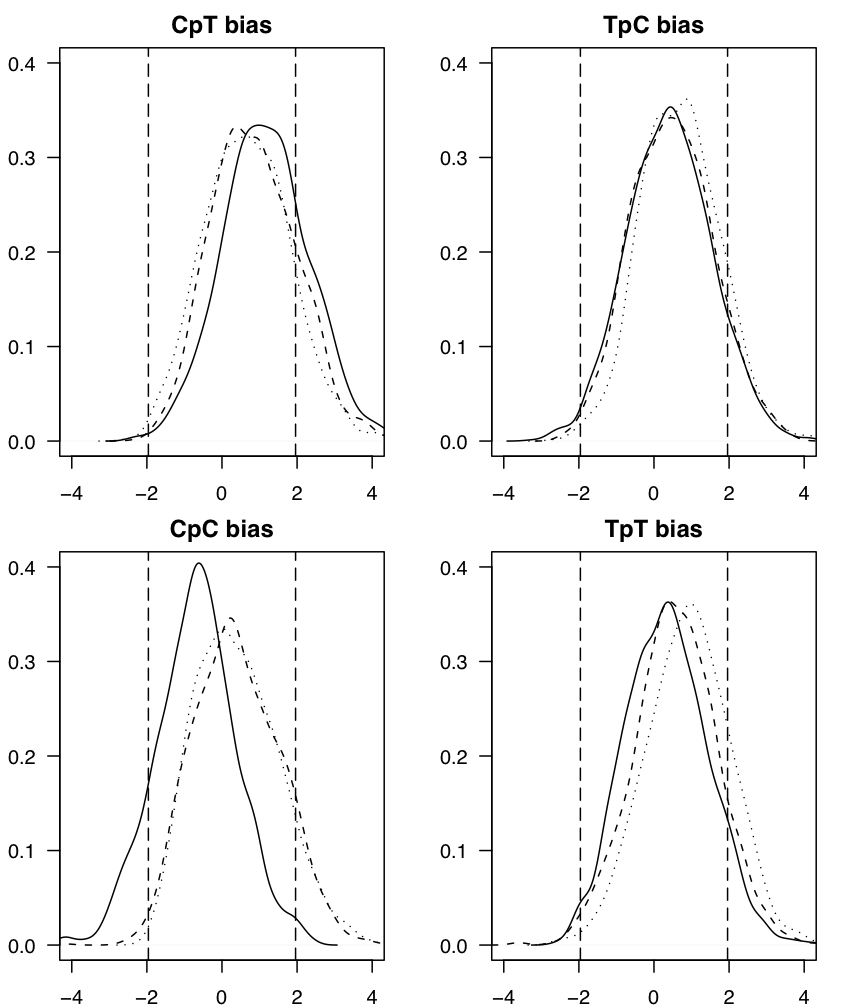
Figure 3 -- Each figure shows the distributions of the z-score
in all coding sequences corresponding to each of the three
strains of Prochlorococcus marinus. In each figure, the
distribution for the MED4 (a high-light adapted strain) is shown as
a solid line; the distribution for the SS120 (a low-light adapted
strain) is shown as a dashed line, and the distribution for the MIT
9313 (a low-light adapted strain) is shown as a dotted line. The 5%
limits of significance for the standard normal distribution (dashed
vertical lines) are plotted as benchmarks.
If you have any problems or comments, please contact
Palmeira, L..