This page allows for the on-line reproduction of the figures
in the paper:
Lobry, J.R.,
Chessel, D.
(2003)
Internal correspondence analysis of codon and amino-acid usage in thermophilic bacteria.
Journal of Applied Genetics, 44:235-261.
[DATASET]
[PDF]
Abstract: Starting from two datasets of codon usage in coding sequences from mesophilic and thermophilic bacteria we have used internal correspondence analysis to study the variability of codon usage within and between species, and within and between amino-acids. The first dataset included 18,958,458 codons from 58,482 coding sequences from 25 completely sequenced genomes along with 6,793,581 dinucleotides from 21,876 intergenic spaces. A second dataset with partially sequenced genomes included 97,095,873 codons from 293 bacterial species. Results were consistent between the two datasets. The trend for the amino-acid composition of thermophilic proteins was found to be under the control of a pressure at the nucleic acid level, not a selection at the protein level. This effect was no more present in intergenic spaces ruling out a pressure at the DNA level. The pattern at the mRNA level was more complex than a simple purine enrichment of sense strand of coding sequences. Outliers in the partial genome dataset introduced a note of caution about the interpretation of temperature as the direct determinant of the trend observed in thermophiles. The surprising lack of selection on the amino acid content in thermophilic proteins suggested that the amino acid repertoire was set up in a hot environment.
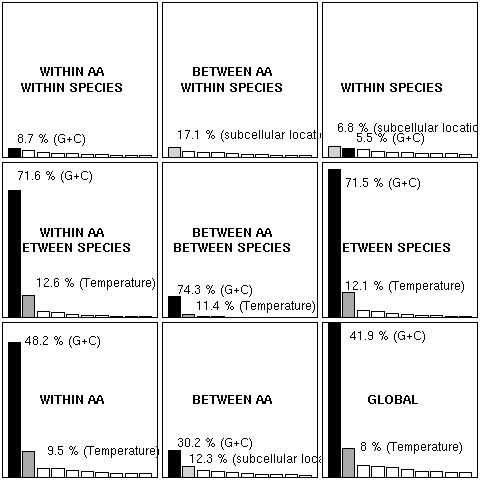
Figure 1. Eigenvalue graphs for internal correspondence analysis and associated analyses of codon usage in 58,482 bacterial coding sequences from 25 complete genomes. The eigenvalue for a given factor is proportional to the variance in the table under analysis that is accounted for by that factor. Conceptually assigned factors were colorized as follows: black for the G+C content effect, dark gray for temperature effect, and light gray for the sub cellular location effect. The relative contribution of one factor within an analysis is also indicated in percentage for assigned factors. All the graphs are at the same scale (only the first 10 eigenvalues were represented) to allow for a direct visual comparison.
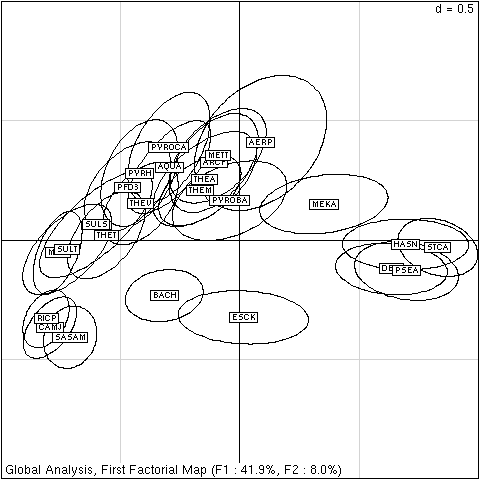
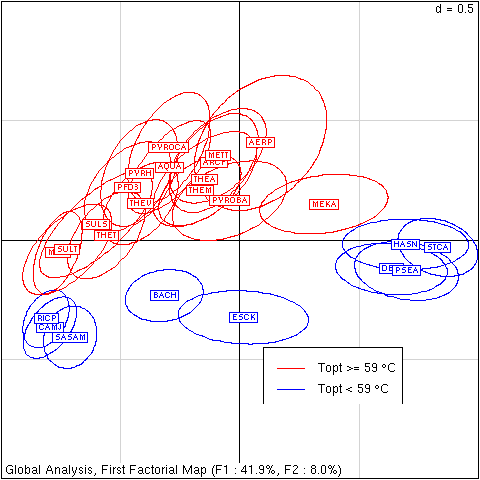
Figure 2. First factorial map for global analysis of codon usage in 58,482 coding sequences. Points corresponding to coding sequences are too numerous to plot, they have been summarized on a species basis by ellipses containing 95% of them. Low G+C species are on the left, high G+C on the right. Thermophilic species are on the top, mesophilic on the bottom. Species names were abbreviated as follows: Aeropyrum pernix (AERP), Aquifex Aeolicus (AQUA), Archaeoglobus fulgidus (ARCF), Bacillus halodurans (BACH), Campylobacter jejuni (CAMJ), Deinococcus radiodurans (DEIR), Escherichia coli K12 (ESCK), Halobacterium sp. NRC-1 (HASN), Methanococcus jannaschii (METJ), Methanopyrum kandleri AV19 (MEKA), Methanothermobacter thermoautotrophicus (METT), Pseudomonas aeruginosa (PSEA), Pyrobaculum aerophilum (PYROBA), Pyrococcus abyssi (PYROCA), Pyrococcus furiosus DSM 3638 (PFD3), Pyrococcus horikoshii (PYRH), Rickettsia prowazekii (RICP), Staphylococcus aureus subsp. aureus MU50 (SASAM), Streptomyces coelicolor A3(2) (STCA), Sulfolobus solfataricus (SULS), Sulfolobus tokodaii (SULT), Thermoanaerobacter tengcongensis (THET), Thermoplasma acidophilum (THEA), Thermoplasma volcanium (THEV), Thermotoga maritima (THEM).
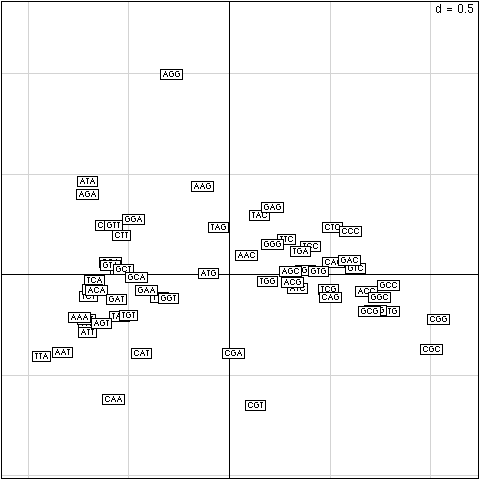
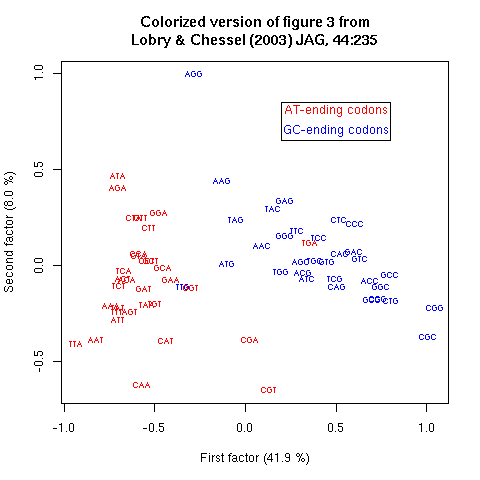
Figure 3. Codon positions on the first factorial map for global analysis of codon usage in 58,482 coding sequences. AT rich codons are on the left, GC rich codons on the right. Codons preferred in thermophilic bacteria on the top, codons avoided in thermophilic bacteria on the bottom.
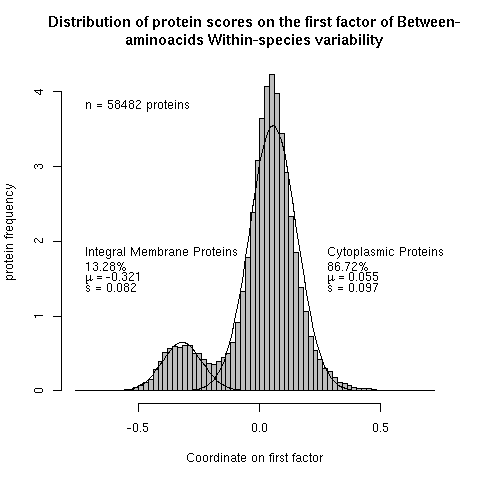
Figure 4. Bimodal distribution of 58,482 protein scores on the first factor of between-amino acid and within-species variability. The line represents the maximum-likelihood estimate for a mixture of two normal distributions.
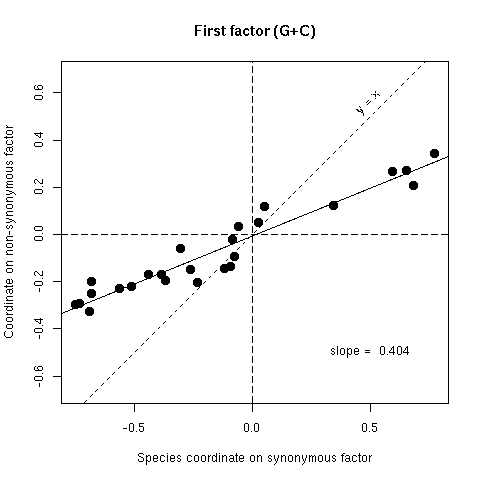
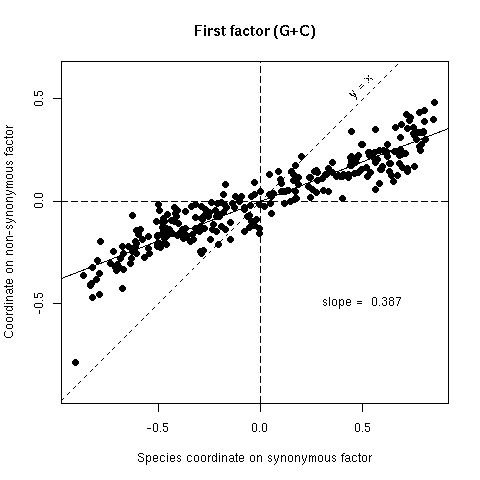
Figure 5a. Comparison of synonymous (x-axis) and non-synonymous (y-axis) codon usage in 25 bacterial species. Each species is represented by a point with coordinates on the first factor of codon usage analyses. If there was no selection on the average amino-acid content of proteins points should lie on the y = x line, if there was an absolute selection on the average amino acid content points should lie on the horizontal axis, observed slopes values (from orthogonal regression) are intermediate between these two extreme theoretical situations. Note that since the first factor of variability is the G+C content, this is very similar to Sueoka's neutrality plot : the synonymous coordinate for G+C is close to P3 and the non-synonymous coordinate to P12 (cf SUEOKA 1988).
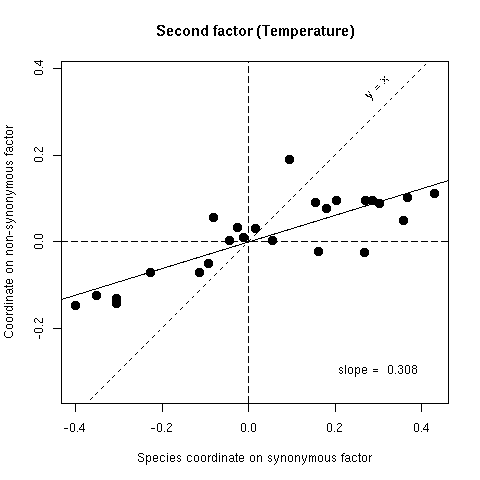
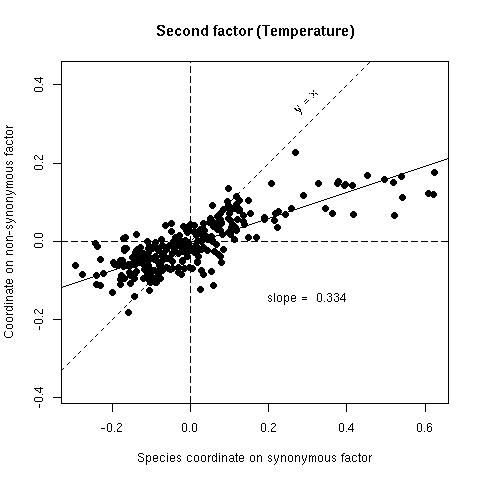
Figure 5b. Comparison of synonymous (x-axis) and non-synonymous (y-axis) codon usage in 25 bacterial species. Each species is represented by a point with coordinates on the second factor of codon usage analyses. If there was no selection on the average amino-acid content of proteins points should lie on the y = x line, if there was an absolute selection on the average amino acid content points should lie on the horizontal axis, observed slopes values (from orthogonal regression) are intermediate between these two extreme theoretical situations.
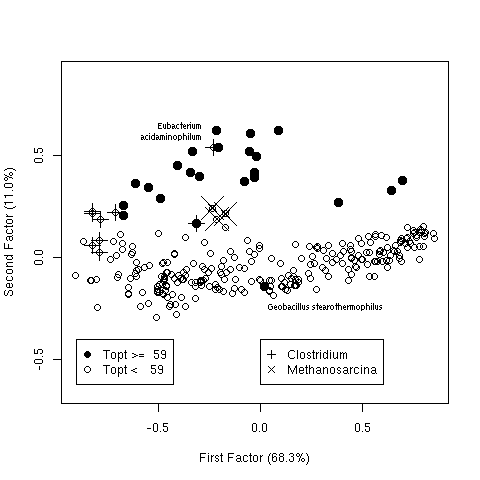
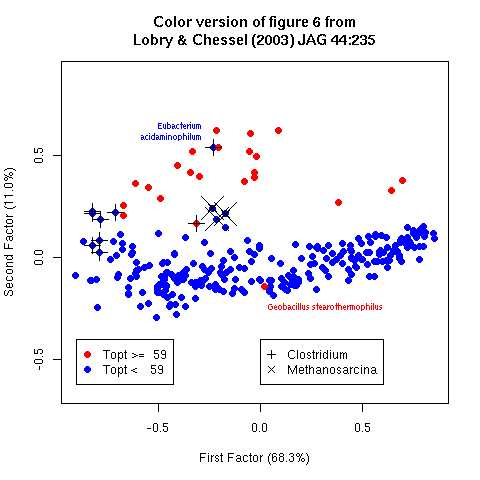
Figure 6. First factorial map for synonymous codon usage in 293 bacteria. Filled points correspond to thermophilic species and open points to mesophilic species. The first factor is the G+C content with low G+C species on the left and high G+C species on the right, the second factor is linked to thermophily with almost all thermophilic species on the top. Some outliers of interest for the discussion are outlined.
Figure 7a. Same as figure 5a but for the partial genome dataset with 293 bacteria.
Figure 7b. Same as figure 5b but for the partial genome dataset with 293 bacteria.
If you have any problems or comments, please contact
Jean Lobry.