This page allows for the on-line reproduction (and some updates)
of the figures in the paper:
Lobry, J.R. (1995) Properties of a general model of DNA evolution under no-strand bias conditions. Journal of Molecular Evolution,
40:326-330; 41:680.
[
PDF]
Abstract:
Under the hypothesis of no-strand-bias conditions, the Watson and
Crick base-pairing rule decreases the complexity of models of DNA
evolution by reducing to six the maximum number of substitution rates.
It was shown that intrastrand equimolarity between A and T (A*=T*) and
between G and C (G*=C*) is a general asymptotic property
of this class of models. This statistical prediction was observed on
60 long genomic fragments (> 50 kbp) from various kingdoms, even when
the effect of the two opposite orientations for coding sequences is
removed. The practical consequence of the model for estimating the
expected number of substitutions per site between two homologous DNA
sequences is discussed.
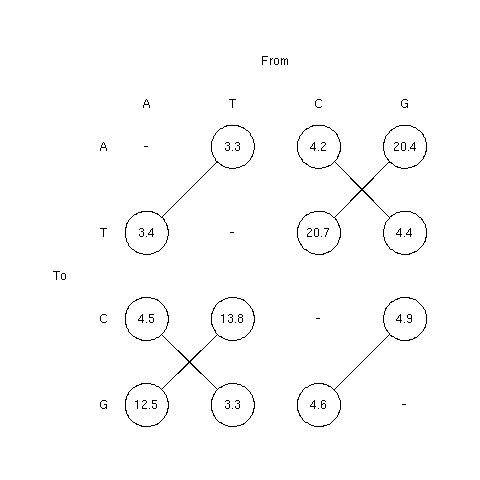
1. The pattern of nucleotide substitutions
Figure 1 showed the pattern of nucleotide substitution, in percent,
estimated from 13 pseudogene sequences by
Li et al. (1984).
Connected substitition rates should be equal under PR1 hypothesis.
The column and row orders were wrong in the original figure (i.e.
A T G C instead of A T C G), this is corrected here. This doesn't change
anything for connected values.
Since then, the estimation of substitution rates from pseudogen
data has been considerably extended. The values just below are
based on the work of
Ron Ophir. The values are from Table 4.5 in the Graur and Li
second edition.
The advantages, as compared with the previous estimate, are that it
is based on a much more consequent dataset (105 pseudogenes) and
from a single taxon (human) so that taxon-specific patterns are
not amalgamated.
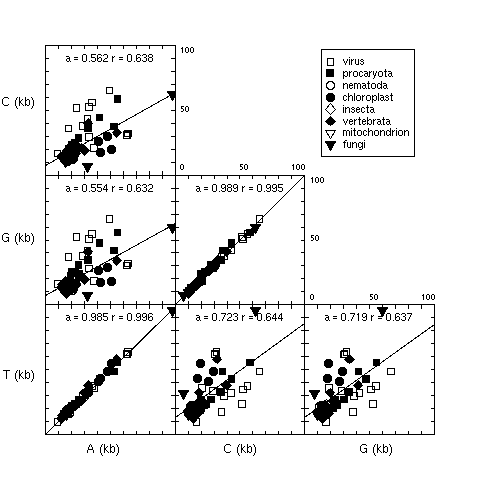
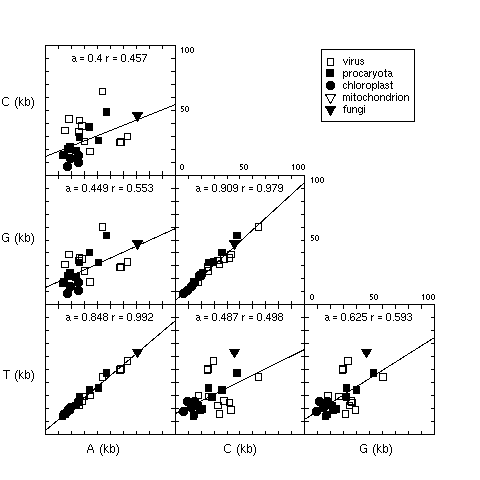
2. Observed base composition in long DNA fragments
Figure 2 showed the base composition in long genomic fragments.
At that time (15 june 1994) there were only 60 sequences with
more than 50 Kbp available in GenBank release 83. For each
panel, the slope, a, of the regression line y = ax + b,
and the linear correlation coefficient, r, were given.
The equalities between the total number of A and T and between
the total number of C and G was striking. Note that these base
counts are from single-stranded DNA, the observed equalities are
not a trivial consequence of base pairing rules in double-
stranded DNA.
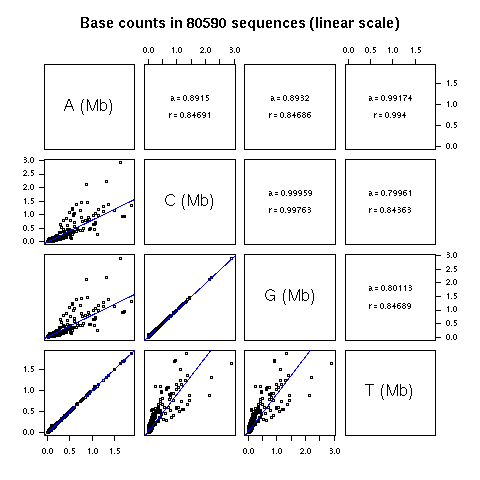
There are now much more data available in GenBank. In release
144 including daily updates up to 24-NOV-2004 I found 117,692
fragments with more than 50 Kbp. One interesting thing is that
since august 2004, the maximum size of 350 Kbp for a GenBank
entry has been relaxed. On the other hand, the "BASE COUNT"
line in GenBank flat files is no more present, so that you can't
just grep them to get the base counts. Anyway, if you want
the base counts in these long fragments I have computed them
for you here.
In the following there are only 80,590 long sequences represented
because I have removed sequences with more than 1% of undetermined
bases.
The slopes are very close to 1 for A vs T and G vs C, which
means that we are very close to A = T and C = G (that is to
PR2 state) on average. Not too bad, the data set is now 1000
times bigger and the prediction of the model still holds (the
total number of bases in this dataset is 13,264,842,944).
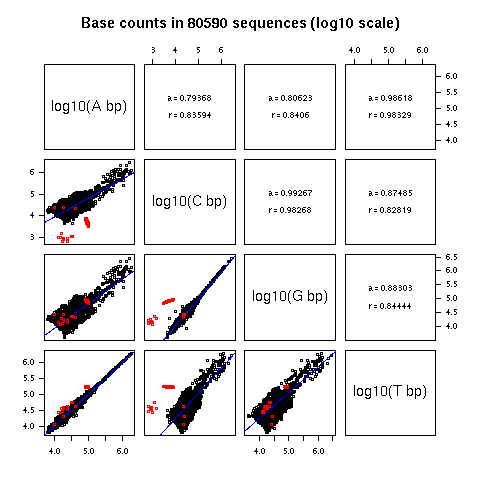
Because the distribution of the size of fragments is highly
skewed, it is also interesting to look at a log-log representation.
The outliers in red below correspond to synthetic fragments,
that is artificial sequences that are not the result of a
long evolutionary history. They are interesting because they
demonstrate that PR2 state is not an instrinsic property
of long ssDNA fragments: there is a priori no reason
to have A = T and C = G in ssDNA.
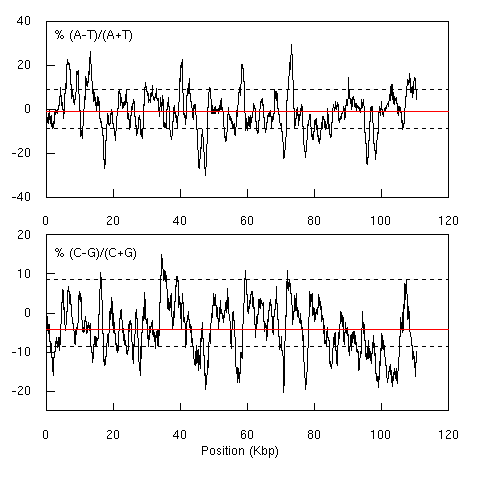
3. Early GC-skew and AT-skew representations
I think this is the first skew diagram I have ever published:
I had some problems to reproduce this figure. First, I have
lost the original sequence file (ECO110K). There is still
an ECO110K entry in GenBank, but it was updated on 23-JAN-2004,
so that I'm not sure to work with exactly the same data. The
version used here is the 23-JAN-2004 version (D10483.2 GI:21321891).
Second, there is a small difference for the location of
the confidence lines, and I'm unable to trace back the trouble
because at that time I was not working under
R but with a commercial
software that is no more maintained, so I can't repeat now what
I have done to produce this figure. I'm affraid that this is
just one more example of what Jonathan Buckheit and David Donoho
called à la recherche des paramètres perdus
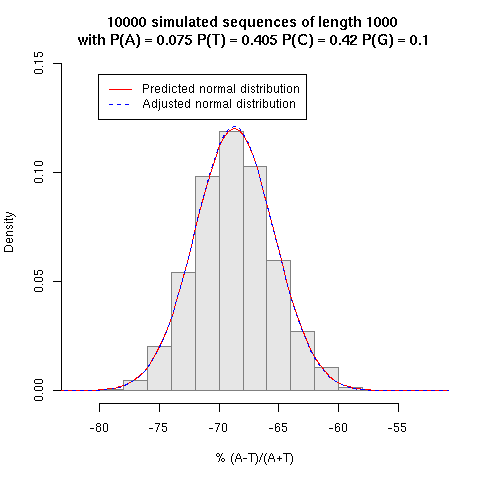
in their famous paper about reproducible research. In the present version of the figure
the confidence lines are based on the formulas given
here and the small simulation just below should convince you that
they are exact.
Last, but not least, the horizontal red lines at the mean value
were not drawn in the original figure. The fragment ECO110K is
just on the right of the origin of replication of the chromosome
(0.0 - 2.4 min region). We know now that this region, corresponding
to the leading strand for replication, is systematically enriched
in G over C. I didn't notice it at that time...
4. Base counts in coding sequences
Figure 4 showed that PR2 state was also found when considering
only the sense strand of coding sequences. For an update see
there.
If you have any problems or comments, please contact
Jean Lobry.