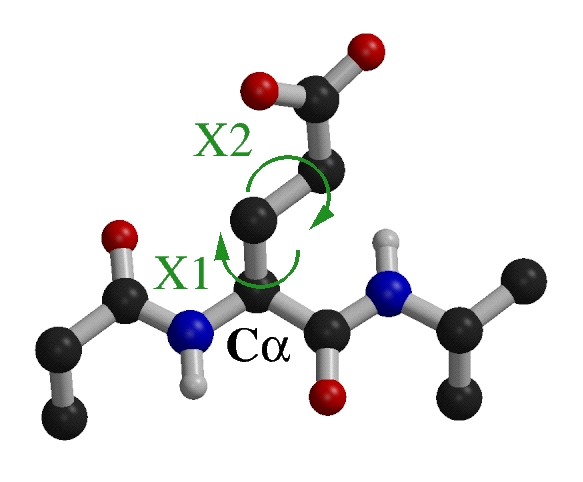
Rotamer definition.
Side chain orientation is defined by its Chi angles.
When the
angles distribution is discrete, the preferred angles can be
defined by rotamers. In this work we focused only on
sp3-sp3 bonding angles, because sp3-sp2 bonding angles
are usually not discrete.
According to the IUPAC-IUB Commission
recommendations we use the three following rotamers:
| Rotamer | Chi |
| g- | (gauche -) | 60±60 |
| t | (trans) | 180±60 |
| g+ | (gauche +) | -60±60 |
We focused on the two first side chains angles, Chi1 and
Chi2.
The Chi1 angle when it exist is always sp3-sp3, so the
Chi1 propensities of all amino acids have been studied (except Ala, Gly and Pro).
The Chi2 angles of Arg, Glu, Gln, Ile, Leu, Lys and Met
are sp3-sp3 so their Chi1-Chi2 combinations have been
studied.
The Chi2 angles of Ser, Thr and Cys are not studied
because they involve the position of an hydrogen atom so
they are usually not defined in X-ray structures. The
other amino acids have no Chi2 angles, or present sp3-sp2
Chi2 bonds so their Chi2 angles are not studied.
|
Chi1 and Chi2 angles of Glu.
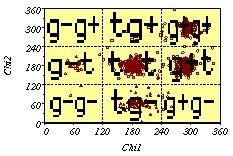
Example of a discrete distribution of Chi1/Chi2.
|
Rotamer distribution of Chi1 in the whole database.
The same database of 299 structures
have been used. The distribution of Chi1 rotamers has been extracted.
(* Val has a different convention for rotamers : g- is -60, t is 60 and g+ is 180)
NEXT.
Preferences in N1.
BACK.
Back to the "Helix N-termini" page.
|
| |
Number in the database |
Percentages |
| Aminoacid |
total |
g- |
t |
g+ |
g- |
t |
g+ |
| Arg |
3407 |
293 |
1162 |
1952 |
9% |
34% |
57% |
| Asn |
3785 |
597 |
1149 |
2039 |
16% |
30% |
54% |
| Asp |
4847 |
870 |
1541 |
2436 |
18% |
32% |
50% |
| Cys |
1134 |
183 |
314 |
637 |
16% |
28% |
56% |
| Gln |
2867 |
232 |
901 |
1733 |
8% |
31% |
60% |
| Glu |
4454 |
472 |
1452 |
2529 |
11% |
33% |
57% |
| His |
1777 |
244 |
582 |
951 |
14% |
33% |
54% |
| Ile |
4264 |
569 |
430 |
3265 |
13% |
10% |
77% |
| Leu |
6361 |
101 |
2053 |
4207 |
2% |
32% |
66% |
| Lys |
4546 |
367 |
1543 |
2634 |
8% |
34% |
58% |
| Met |
1601 |
141 |
460 |
999 |
9% |
29% |
62% |
| Phe |
3223 |
389 |
1108 |
1725 |
12% |
34% |
54% |
| Ser |
4903 |
2224 |
1161 |
1518 |
45% |
24% |
31% |
| Thr |
4685 |
2243 |
377 |
2065 |
48% |
8% |
44% |
| Trp |
1253 |
202 |
421 |
630 |
16% |
34% |
50% |
| Tyr |
2999 |
384 |
1021 |
1594 |
13% |
34% |
53% |
| Val* |
5524 |
1096 |
449 |
3978 |
20% |
8% |
72% |
| Total |
61630 |
10607 |
16124 |
34892 |
17% |
26% |
57% |
Chi1 distribution in the database.
|
Rotamer preferences of Chi1 in N1 position.
Propensities are the ratio of the rotamer percentage in the position
and the rotamer percentage in the database. The general preference in N1 is to
be in t conformation (41% of the total in t at N1 against 26% in the database, propensity equal 1.6) but not Asn, Asp, Cys, His and Thr.
NEXT.
Preferences in N2.
PREVIOUS.
Distribution in database .
BACK.
Back to the "Helix N-termini" page.
|
| |
Number in N1 position |
Percentages |
Propensities |
| Aminoacid |
total |
g- |
t |
g+ |
g- |
t |
g+ |
g- |
t |
g+ |
| Arg |
81 |
8 |
49 |
24 |
10% |
60% |
30% |
1.1±0.4 |
1.8±0.2 |
0.5±0.1 |
| Asn |
47 |
4 |
10 |
33 |
9% |
21% |
70% |
0.5±0.3 |
0.7±0.2 |
1.3±0.1 |
| Asp |
100 |
8 |
13 |
79 |
8% |
13% |
79% |
0.4±0.2 |
0.4±0.1 |
1.6±0.1 |
| Cys |
17 |
2 |
3 |
12 |
12% |
18% |
71% |
0.7±0.5 |
0.6±0.4 |
1.3±0.2 |
| Gln |
97 |
3 |
60 |
34 |
3% |
62% |
35% |
0.4±0.2 |
2.0±0.2 |
0.6±0.1 |
| Glu |
153 |
13 |
71 |
69 |
8% |
46% |
45% |
0.8±0.2 |
1.4±0.2 |
0.8±0.1 |
| His |
32 |
8 |
14 |
10 |
25% |
44% |
31% |
1.8±0.7 |
1.3±0.3 |
0.6±0.2 |
| Ile |
103 |
8 |
38 |
57 |
8% |
37% |
55% |
0.6±0.2 |
3.7±0.6 |
0.7±0.1 |
| Leu |
180 |
0 |
115 |
65 |
0% |
64% |
36% |
0 |
2.0±0.1 |
0.5±0.1 |
| Lys |
121 |
12 |
74 |
35 |
10% |
61% |
29% |
1.2±0.4 |
1.8±0.2 |
0.5±0.1 |
| Met |
37 |
1 |
14 |
22 |
3% |
38% |
59% |
0.3±0.3 |
1.3±0.3 |
1.0±0.1 |
| Phe |
80 |
4 |
55 |
21 |
5% |
69% |
26% |
0.4±0.2 |
2.0±0.2 |
0.5±0.1 |
| Ser |
125 |
56 |
21 |
48 |
45% |
17% |
38% |
1.0±0.1 |
0.7±0.2 |
1.2±0.2 |
| Thr |
97 |
34 |
4 |
59 |
35% |
4% |
61% |
0.7±0.1 |
0.5±0.3 |
1.4±0.1 |
| Trp |
41 |
5 |
20 |
16 |
12% |
49% |
39% |
0.8±0.4 |
1.5±0.3 |
0.8±0.2 |
| Tyr |
83 |
11 |
40 |
32 |
13% |
48% |
39% |
1.0±0.3 |
1.4±0.2 |
0.7±0.1 |
| Val* |
123 |
10 |
25 |
88 |
8% |
20% |
72% |
0.4±0.1 |
2.5±0.6 |
1.0±0.1 |
| Total |
1517 |
187 |
626 |
704 |
12% |
41% |
46% |
0.7±0.1 |
1.6±0.1 |
0.8±0.0 |
Chi1 propensities in N1 position.
|
Rotamer preferences of Chi1 in N2 position.
Many amino acids (Asn, Asp, Glu, His, Ser and Trp) show a preference
for the g- conformation.
NEXT.
Preferences in N3.
PREVIOUS.
Preferences in N1 .
BACK.
Back to the "Helix N-termini" page.
|
| |
Number in N2 position |
Percentages |
Propensities |
| Aminoacid |
total |
g- |
t |
g+ |
g- |
t |
g+ |
g- |
t |
g+ |
| Arg |
75 |
5 |
37 |
33 |
7% |
49% |
44% |
0.8±0.4 |
1.4±0.2 |
0.8±0.1 |
| Asn |
86 |
19 |
14 |
53 |
22% |
16% |
62% |
1.4±0.3 |
0.5±0.1 |
1.1±0.1 |
| Asp |
234 |
54 |
23 |
157 |
23% |
10% |
67% |
1.3±0.2 |
0.3±0.1 |
1.3±0.1 |
| Cys |
18 |
4 |
5 |
9 |
22% |
28% |
50% |
1.4±0.7 |
1.0±0.4 |
0.9±0.2 |
| Gln |
104 |
9 |
59 |
36 |
9% |
57% |
35% |
1.1±0.4 |
1.8±0.2 |
0.6±0.1 |
| Glu |
313 |
45 |
108 |
160 |
14% |
35% |
51% |
1.4±0.2 |
1.1±0.1 |
0.9±0.1 |
| His |
48 |
12 |
16 |
20 |
25% |
33% |
42% |
1.8±0.6 |
1.0±0.2 |
0.8±0.2 |
| Ile |
61 |
3 |
12 |
46 |
5% |
20% |
75% |
0.4±0.2 |
2.0±0.6 |
1.0±0.1 |
| Leu |
102 |
1 |
52 |
49 |
1% |
51% |
48% |
0.6±0.7 |
1.6±0.2 |
0.7±0.1 |
| Lys |
112 |
8 |
53 |
51 |
7% |
47% |
46% |
0.9±0.3 |
1.4±0.2 |
0.8±0.1 |
| Met |
22 |
1 |
11 |
10 |
5% |
50% |
45% |
0.5±0.5 |
1.7±0.4 |
0.7±0.2 |
| Phe |
64 |
2 |
43 |
19 |
3% |
67% |
30% |
0.3±0.2 |
2.0±0.2 |
0.6±0.1 |
| Ser |
146 |
81 |
19 |
46 |
55% |
13% |
32% |
1.2±0.1 |
0.5±0.1 |
1.0±0.1 |
| Thr |
93 |
18 |
3 |
72 |
19% |
3% |
77% |
0.4±0.1 |
0.4±0.2 |
1.8±0.1 |
| Trp |
30 |
12 |
11 |
7 |
40% |
37% |
23% |
2.5±0.7 |
1.1±0.3 |
0.5±0.2 |
| Tyr |
43 |
5 |
28 |
10 |
12% |
65% |
23% |
0.9±0.4 |
1.9±0.3 |
0.4±0.1 |
| Val* |
85 |
7 |
7 |
71 |
8% |
8% |
84% |
0.4±0.2 |
1.0±0.4 |
1.2±0.1 |
| Total |
1636 |
286 |
501 |
849 |
17% |
31% |
52% |
1.0±0.1 |
1.2±0.1 |
0.9±0.0 |
Chi1 propensities in N2 position.
|
Rotamer preferences of Chi1 in N3 position.
Here is no more amino acid preferences for the g- conformation. Amino acid with a big side chain are prefered in t conformation, the shorter side chain amino preferring the g+ conformation.
NEXT.
Preferences inside the hellix.
PREVIOUS.
Preferences in N2 .
BACK.
Back to the "Helix N-termini" page.
|
| |
Number in N3 position |
Percentages |
Propensities |
| Aminoacid |
total |
g- |
t |
g+ |
g- |
t |
g+ |
g- |
t |
g+ |
| Arg |
76 |
2 |
47 |
27 |
3% |
62 |
36 |
0.3±0.2 |
1.8±0.2 |
0.6±0.1 |
| Asn |
65 |
1 |
11 |
53 |
2% |
17 |
82 |
0.1±0.1 |
0.6±0.2 |
1.5±0.1 |
| Asp |
204 |
3 |
15 |
186 |
1% |
7 |
91 |
0.1±0.0 |
0.2±0.1 |
1.8±0.1 |
| Cys |
19 |
0 |
5 |
14 |
0% |
26 |
74 |
0 |
1.0±0.4 |
1.3±0.2 |
| Gln |
137 |
6 |
23 |
108 |
4% |
17 |
79 |
0.5±0.3 |
0.5±0.1 |
1.3±0.1 |
| Glu |
270 |
6 |
64 |
200 |
2% |
24 |
74 |
0.2±0.1 |
0.7±0.1 |
1.3±0.1 |
| His |
39 |
0 |
10 |
29 |
0% |
26 |
74 |
0 |
0.8±0.2 |
1.4±0.2 |
| Ile |
72 |
2 |
9 |
61 |
3% |
13 |
85 |
0.2±0.2 |
1.2±0.4 |
1.1±0.1 |
| Leu |
134 |
0 |
76 |
58 |
0% |
57 |
43 |
0 |
1.8±0.2 |
0.7±0.1 |
| Lys |
98 |
2 |
52 |
44 |
2% |
53 |
45 |
0.3±0.2 |
1.6±0.2 |
0.8±0.1 |
| Met |
41 |
1 |
16 |
24 |
2% |
39 |
59 |
0.3±0.3 |
1.4±0.3 |
0.9±0.1 |
| Phe |
82 |
1 |
49 |
32 |
1% |
60 |
39 |
0.1±0.1 |
1.7±0.2 |
0.7±0.1 |
| Ser |
97 |
39 |
13 |
45 |
40% |
13 |
46 |
0.9±0.1 |
0.6±0.2 |
1.5±0.2 |
| Thr |
131 |
27 |
2 |
102 |
21% |
2 |
78 |
0.4±0.1 |
0.2±0.1 |
1.8±0.1 |
| Trp |
38 |
0 |
26 |
12 |
0% |
68 |
32 |
0 |
2.0±0.3 |
0.6±0.2 |
| Tyr |
71 |
1 |
40 |
30 |
1% |
56 |
42 |
0.1±0.1 |
1.7±0.2 |
0.8±0.1 |
| Val* |
128 |
7 |
9 |
112 |
5% |
7 |
88 |
0.3±0.1 |
0.9±0.3 |
1.2±0.1 |
| Total |
1702 |
98 |
467 |
1137 |
6% |
27% |
67% |
0.3±0.1 |
1.0±0.1 |
1.2±0.1 |
Chi1 propensities in N3 position.
|
Rotamer preferences of Chi1 inside the helix (N4 to C4).
The g- conformation is still higly unfavoured. Only 3% of the
side chain are in g-.
NEXT.
Summary of rotamer preferences.
PREVIOUS.
Preferences in N3 .
BACK.
Back to the "Helix N-termini" page.
|
| |
Number between N4 and C4 |
Percentages |
Propensities |
| Aminoacid |
total |
g- |
t |
g+ |
g- |
t |
g+ |
g- |
t |
g+ |
| Arg |
621 |
11 |
296 |
314 |
2% |
48% |
51% |
0.2±0.1 |
1.4±0.1 |
0.9±0.1 |
| Asn |
415 |
0 |
97 |
318 |
0% |
23% |
77% |
0 |
0.8±0.1 |
1.4±0.1 |
| Asp |
493 |
3 |
118 |
372 |
1% |
24% |
75% |
0 |
0.8±0.1 |
1.5±0.1 |
| Cys |
126 |
4 |
39 |
83 |
3% |
31% |
66% |
0.2±0.1 |
1.1±0.2 |
1.2±0.1 |
| Gln |
558 |
7 |
207 |
344 |
1% |
37% |
62% |
0.2±0.1 |
1.2±0.1 |
1.0±0.0 |
| Glu |
701 |
13 |
288 |
400 |
2% |
41% |
57% |
0.2±0.1 |
1.3±0.1 |
1.0±0.1 |
| His |
204 |
2 |
113 |
89 |
1% |
55% |
44% |
0.1±0.1 |
1.7±0.2 |
0.8±0.1 |
| Ile |
827 |
20 |
33 |
774 |
2% |
4% |
94% |
0.2±0.1 |
0.4±0.1 |
1.2±0.1 |
| Leu |
1364 |
1 |
532 |
831 |
0% |
39% |
61% |
0.0±0.1 |
1.2±0.1 |
0.9±0.0 |
| Lys |
737 |
12 |
341 |
383 |
2% |
46% |
52% |
0.2±0.1 |
1.4±0.1 |
0.9±0.0 |
| Met |
375 |
6 |
110 |
259 |
2% |
29% |
69% |
0.2±0.1 |
1.0±0.1 |
1.1±0.1 |
| Phe |
505 |
2 |
339 |
163 |
0% |
67% |
32% |
0.0±0.0 |
2.0±0.1 |
0.6±0.0 |
| Ser |
461 |
86 |
136 |
239 |
19% |
30% |
52% |
0.4±0.0 |
1.2±0.1 |
1.7±0.1 |
| Thr |
497 |
72 |
2 |
423 |
14% |
0% |
85% |
0.3±0.1 |
0.1±0.1 |
1.9±0.1 |
| Trp |
192 |
4 |
125 |
63 |
2% |
65% |
33% |
0.1±0.1 |
1.9±0.2 |
0.7±0.1 |
| Tyr |
446 |
4 |
295 |
147 |
1% |
66% |
33% |
0.1±0.0 |
1.9±0.1 |
0.6±0.1 |
| Val* |
865 |
36 |
23 |
806 |
4% |
3% |
93% |
0.2±0.1 |
0.3±0.1 |
1.3±0.1 |
| Total |
9387 |
283 |
3094 |
6008 |
3% |
33% |
64% |
0.2±0.1 |
1.3±0.1 |
1.1±0.1 |
Chi1 propensities in N4 to C4 position.
|
Summary of rotamer Chi1 preferences.
The structural preferences are different in N1, N2, N3 and inside the helix.
Hydrogen bonding and steric clashes are the major causes of these differences:
Firstly the hydrogen bonding possibility in N1, N2, N3 are different than
those inside the helix (N4 to C4) where the NH backbone group are involved in (i, i+4) hydrogen bonds. Secondly the side chain are more confined inside the helix than in N1, N2, N3.
The N2 position presents the higher proportion (17%) of g- conformation. In this position Asn, Asp, (Gln,) Glu, His, Ser and Trp have a propensity higher than 1 for this conformation.
In the next step, Chi1/Chi2 propensity are studied.
NEXT.
Chi1/Chi2 Preferences in N2 .
PREVIOUS.
Preferences in N4 to C4 .
BACK.
Back to the "Helix N-termini" page.
TOP.
top of this page page.
|