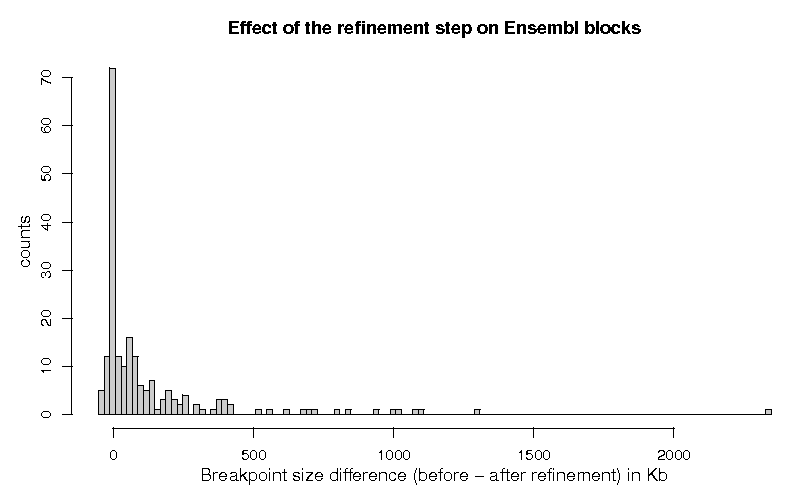
(5 values larger than 5 Mbp have been removed for the purpose of readability)
To execute this comparison, we obtained all necessary information from the Ensembl Genome Brower site (Build 57).
The Build 57 was released in March 3rd, 2010 and contains information about the Homo sapiens assembly GRCh37 (released in February 2009) and about the Mus musculus assembly NCBI m37 (released in April 2007).
The FASTA sequences of the chromosomes 1, 2, 3, 4, 5, 6, 7, 8, 9, 10, 11, 12, 13, 14, 15, 16, 17, 18, 19, 20, 21, 22 and X of the Homo sapiens and of the chromosomes 1, 2, 3, 4, 5, 6, 7, 8, 9, 10, 11, 12, 13, 14, 15, 16, 17, 18, 19 and X of the Mus musculus were downloaded from the Ensembl FTP site:
We downloaded some mysql table dumps of the
Compara database (dnafrag.onlychromosome.txt,
dnafrag_region.txt and,
synteny_region.txt) and we processed these files to obtain the list
of orthologous synteny blocks.
Download the list of
orthologous synteny blocks
The Compara database has 345 orthologous synteny blocks identified in the genomes of Homo sapiens and Mus musculus. Table 1 shows the minimum, maximum, mean and median length of these blocks.
| Description | N | Homo sapiens [length in bp] | Mus musculus [length in bp] | ||||||
| Min | Max | Mean | Median | Min | Max | Mean | Median | ||
| Compara database | 345 | 108,946 | 58,118,452 | 7,844,447 | 3,697,691 | 102,552 | 52,624,330 | 7,077,399 | 3,172,511 |
By processing these synteny blocks, Cassis identified 292 breakpoints. A total of 234 breakpoints can be processed by the segmentation process while the remaining 58 cannot because they do not meet the minimum length of 50,000 bp (caused by synteny block overlapping). Table 2 shows the distribution of the 292 identified breakpoints according to their classification.
| Description | Status | Number of breakpoints |
| Sequences SR, SA and, SB have their lengths bigger than the minimum limit. | 1 | 234 |
| Sequence SA is smaller than the allowed limit. | -3 | 27 |
| Sequence SB is smaller than the allowed limit. | -4 | 22 |
| Sequences SA and SB are smaller than the allowed limit. | -5 | 9 |
The 234 breakpoints which have sequences SR, SA and, SB with length bigger than or equal to 50,000 bp were processed by the segmentation step. Table 3 shows the minimum, maximum, mean and median breakpoint length before and after the segmentation process. It also shows the number of breakpoints which received status 1, 0 or, -1 (passed (1) or failed (0) in the statistical test that evaluates the significance of the segmentation or had no hits (-1) on the alignments of the sequences SR against SA and SR against SB).
| Description | N | Before segmentation [length in bp] | After segmentation [length in bp] | ||||||
| Min | Max | Mean | Median | Min | Max | Mean | Median | ||
| All breakpoints | 234 | 1 | 15,172,525 | 463,422 | 114,679 | 21 | 4,238,335 | 163,619 | 65,865 |
| Status = 1 | 207 | 1 | 15,172,525 | 503,025 | 124,520 | 21 | 4,238,335 | 164,782 | 53,257 |
| Status = 0 | 26 | 1,386 | 521,357 | 160,279 | 77,096 | 14,773 | 532,964 | 154,983 | 100,582 |
| Status = -1 | 1 | 147,243 | 147,243 | 147,243 | 147,243 | 147,243 | 147,243 | 147,243 | 147,243 |
Of the 234 breakpoints which were classified with status 1, a total of 83 breakpoints had their length increased after the segmentation. Table 4 shows the minimum, maximum, mean and median length of these breakpoints, before and after the segmentation process.
| Description | N | Before segmentation [length in bp] | After segmentation [length in bp] | ||||||
| Min | Max | Mean | Median | Min | Max | Mean | Median | ||
| Length (after) ≥ Length (before) | 83 | 1 | 543,101 | 70,602 | 24,923 | 21 | 543,249 | 77,229 | 33,298 |
A total of 124 breakpoints were classified with status 1 and had their length decreased after the segmentation process. Table 5 shows the minimum, maximum, mean and median length of these breakpoints, before and after the segmentation process.
| Description | N | Before segmentation [length in bp] | After segmentation [length in bp] | Length reduction [%] | |||||||||
| Min | Max | Mean | Median | Min | Max | Mean | Median | Min | Max | Mean | Median | ||
| Length (after) < Length (before) | 124 | 848 | 15,172,525 | 792,470 | 251,879 | 174 | 4,238,335 | 223,386 | 73,567 | 0.25 | 99.86 | 57.30 | 61.32 |
Figure 1 shows the histogram of the differences of the breakpoint lengths, before and after the segmentation step, for the 202 breakpoints which were classified with status 1.