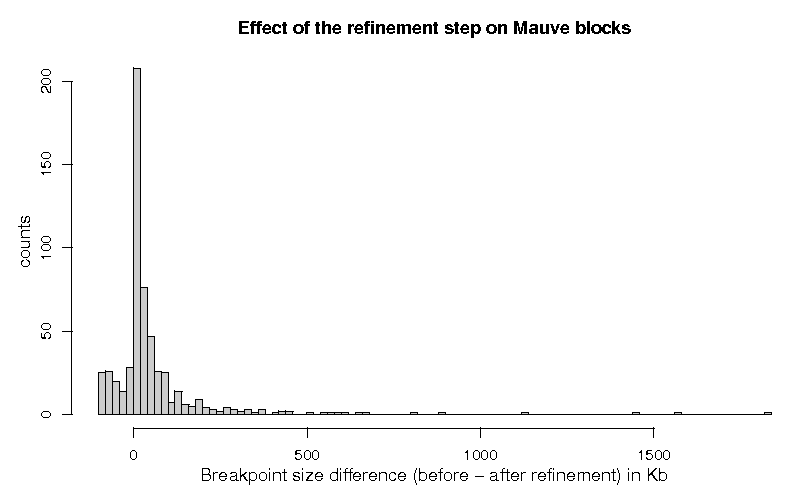
(3 values larger than 2 Mbp have been removed for the purpose of readability)
Mauve is able to work with multiple genomes but Cassis works with just a pair of genomes. Thus, to perform a comparative study, we decided to use Mauve to obtain the list of LCBs which can be found in the genomes of Homo sapiens and Mus musculus.
To do this, we adopted the same parameters used by Mauve's authors in the study of the human, mouse and rat genomes.
We produced two FASTA files (one for the human and other for the mouse genome) containing the sequences of all chromosomes (except chromosome Y) and we executed the following command line:
Mauve concatenates the sequences that are inside of a FASTA file into a single sequence. Thus, it performed the analysis of two sequences with, respectively, 3,036,303,846 bp for the human genome and 2,638,992,663 bp for the mouse genome. The parameter --seed-size defines the minimum anchor length and the parameter --weight determines the minimum weight for the LCBs. The parameter --no-recursion turns off the full alignment of the LCBs. Finally, the files Human.sml and Mouse.sml correspond to the Sorted Mer Lists which are used by the algorithm (if they do not exist, the program creates them).
In the output produced by Mauve (file output.mauve), we found the definition of 2022 intervals. From this set of intervals, we could identify 674 LCBs which have fragments that are shared by both genomes. From this set of LCBs, we discarded two LCBs which contain the intervals of different chromosomes in the same genome: one LCB contains the end of chromosome 10 and the beginning of chromosome 11 and the other contains the end of chromosome 14 and the beginning of chromosome 15 (both in the human genome). Table 1 summarises the minimum, maximum, mean and median length of these LCBs.
| Description | N | Homo sapiens [length in bp] | Mus musculus [length in bp] | ||||||
| Min | Max | Mean | Median | Min | Max | Mean | Median | ||
| "Good" LCBs | 672 | 98 | 58,978,356 | 3,964,687 | 717,051 | 98 | 48,176,114 | 3,588,420 | 545,930 |
| Discarded | 2 | 17,532,868 | 71,148,726 | 44,340,797 | 44,340,797 | 15,457,004 | 43,737,829 | 29,597,416 | 29,597,416 |
To perform a comparison, Table 2 shows the minimum, maximum, mean and median length of the synteny blocks extracted from the Compara database of Ensembl.
| Description | N | Homo sapiens [length in bp] | Mus musculus [length in bp] | ||||||
| Min | Max | Mean | Median | Min | Max | Mean | Median | ||
| Compara database | 345 | 108,946 | 58,118,452 | 7,844,447 | 3,697,691 | 102,552 | 52,624,330 | 7,077,399 | 3,172,511 |
Mauve has almost twice more blocks than Compara and they are smaller than the ones from Compara. Moreover some blocks from Mauve are very small, with 111 (16.5%) blocks less than 5 Kbp.
Cassis was used to process the list of 672 LCBs which are defined by Mauve. Our package identified a total of 649 breakpoints and all of them were processed by the segmentation step. Table 3 shows the minimum, maximum, mean and median breakpoint length before and after the segmentation process. It also shows the number of breakpoints which received status 1 or 0 (respectively, passed or failed in the statistical test that evaluates the significance of the segmentation).
| Description | N | Before segmentation [length in bp] | After segmentation [length in bp] | ||||||
| Min | Max | Mean | Median | Min | Max | Mean | Median | ||
| All breakpoints | 649 | 2 | 29,940,399 | 311,898 | 59,543 | 6 | 11,577,359 | 177,551 | 51,471 |
| Status = 1 | 582 | 49 | 29,940,399 | 342,103 | 68,791 | 6 | 11,577,359 | 193,671 | 59,525 |
| Status = 0 | 67 | 2 | 699,084 | 49,516 | 12,765 | 78 | 697,008 | 37,527 | 14,388 |
From the 582 breakpoints which were classified with status 1, a total of 118 breakpoints had their length increased after the segmentation. Table 4 shows the minimum, maximum, mean and median length of these breakpoints, before and after the segmentation process.
| Description | N | Before segmentation [length in bp] | After segmentation [length in bp] | ||||||
| Min | Max | Mean | Median | Min | Max | Mean | Median | ||
| Length (after) ≥ Length (before) | 118 | 49 | 1,280,914 | 49,899 | 11,688 | 1,323 | 1,298,477 | 100,421 | 78,253 |
A total of 464 breakpoints were classified with status 1 and had their length decreased after the segmentation process. Table 5 shows the minimum, maximum, mean and median length of these breakpoints, before and after the segmentation process.
| Description | N | Before segmentation [length in bp] | After segmentation [length in bp] | Length reduction [%] | |||||||||
| Min | Max | Mean | Median | Min | Max | Mean | Median | Min | Max | Mean | Median | ||
| Length (after) < Length (before) | 464 | 2,143 | 29,940,399 | 416,414 | 98,389 | 6 | 11,577,359 | 217,385 | 48,285 | 0.01 | 99.98 | 41.22 | 35.02 |
Figure 1 shows the histogram of the differences of the breakpoint lengths, before and after the segmentation step, for the 579 breakpoints which were classified with status 1.