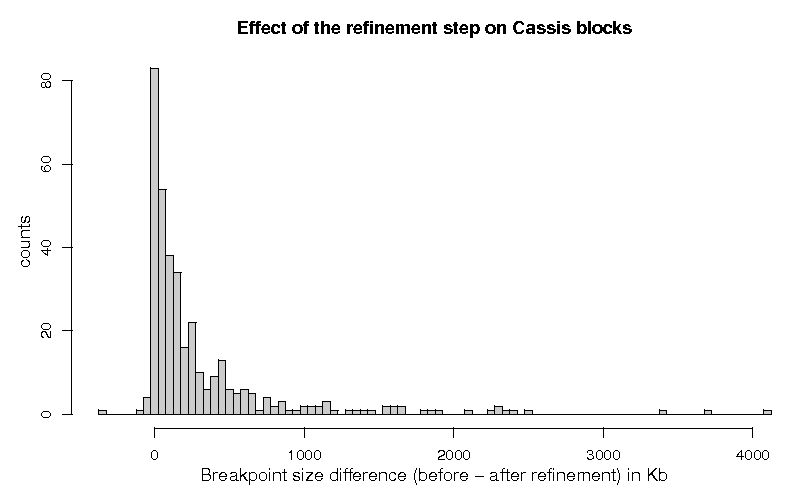
(7 values larger than 5 Mbp have been removed for the purpose of readability)
The package Cassis was used for the comparison of the genomes of the species Homo sapiens (reference genome) and Mus musculus.
To execute this comparison, we obtained all necessary information from the Ensembl Genome Brower site (Build 57).
The Build 57 was released in March 3rd, 2010 and contains information about the Homo sapiens assembly GRCh37 (released in February 2009) and about the Mus musculus assembly NCBI m37 (released in April 2007).
The FASTA sequences of the chromosomes 1, 2, 3, 4, 5, 6, 7, 8, 9, 10, 11, 12, 13, 14, 15, 16, 17, 18, 19, 20, 21, 22 and X of the Homo sapiens and of the chromosomes 1, 2, 3, 4, 5, 6, 7, 8, 9, 10, 11, 12, 13, 14, 15, 16, 17, 18, 19 and X of the Mus musculus were downloaded from the Ensembl FTP site:
The list of orthologous genes was produced with data obtained through the
Biomart tool. We
downloaded the list of all orthologous genes which can be found between
Homo sapiens and Mus musculus and the list of all
Mus musculus genes. We processed these two lists with the script
util/createOne2OneTable.pl (available in the Cassis package)
to produce a TSV (Tab Separated Values) file containing all one-to-one
orthologous genes.
Download the list of one-to-one
orthologous genes
The list of 15,047 pairs of one-to-one orthologous genes was processed by the package Cassis.
In the first step of the method, Cassis identified a total of 369 breakpoints. In the second step, these breakpoints were submitted to the segmentation process.
Table 1 shows the minimum, maximum, mean and median breakpoint length before and after the segmentation process. It also shows the number of breakpoints which received status 1 or 0 (respectively, passed or failed in the statistical test that evaluates the significance of the segmentation).
| Description | N | Before segmentation [length in bp] | After segmentation [length in bp] | ||||||
| Min | Max | Mean | Median | Min | Max | Mean | Median | ||
| All breakpoints | 369 | 1 | 32,752,838 | 771,401 | 244,568 | 21 | 5,133,352 | 201,251 | 52,986 |
| Status = 1 | 365 | 1 | 32,752,838 | 775,512 | 244,568 | 21 | 5,133,352 | 203,057 | 53,262 |
| Status = 0 | 4 | 79,048 | 1,031,931 | 396,243 | 236,998 | 2,069 | 72,226 | 36,459 | 35.771 |
Of the 365 breakpoints which were classified with status 1, a total of 25 breakpoints had their length increased after the segmentation. Table 2 shows the minimum, maximum, mean and median length of these breakpoints, before and after the segmentation process.
| Description | N | Before segmentation [length in bp] | After segmentation [length in bp] | ||||||
| Min | Max | Mean | Median | Min | Max | Mean | Median | ||
| Length (after) ≥ Length (before) | 25 | 1 | 5,115,573 | 282,827 | 34,067 | 1,539 | 5,133,352 | 311,471 | 51,645 |
A total of 340 breakpoints were classified with status 1 and had their length decreased after the segmentation process. Table 3 shows the minimum, maximum, mean and median length of these breakpoints, before and after the segmentation process.
| Description | N | Before segmentation [length in bp] | After segmentation [length in bp] | Length reduction [%] | |||||||||
| Min | Max | Mean | Median | Min | Max | Mean | Median | Min | Max | Mean | Median | ||
| Length (after) < Length (before) | 340 | 303 | 32,752,838 | 811,739 | 256,577 | 21 | 4,860,908 | 195,085 | 54,883 | 0.31 | 99.99 | 62.26 | 71.20 |
Figure 1 shows the histogram of the differences of the breakpoint lengths, before and after the segmentation step, for the 358 breakpoints which were classified with status 1.