The famous acronym for "Garbage In, Garbage Out" is also valid here. Oriloc output is only as good as the data entered: if erroneous data are used, the resulting output will also be erroneous. Oriloc uses annotated complete genome sequence data so that errors could be at the sequence level or at the annotation level.
The sequencing error effect is most likely low because its rate (say one wrong base out of 10,000) is low. However, we cannot exclude, in some extreme cases in the spirit of Nostoc sp NC_003272, that most of the signal is due to sequencing errors. Imagine a genome that would be a long repetition of CpG dinucleotides (hard to figure how it could be functional!), then in the true sequence we have exactly C=G, and all observed deviations are due to sequencing errors only. The more we are close to A=T and C=G in the true sequence, the more we will be sensitive to sequencing errors to appreciate deviations from C=G and A=T.
The second source of errors is at the annotation level. Oriloc uses only a subset of the complete sequence, namely only positions correspondind to third codon positions in coding sequences. If the annotations are wrong then positions that should be normally excluded could be included. This may have dramatic effects especially in case of frameshifting: using second codon positions as if they were third codon positions yields meaningless results because second codon positions are under a strong selective pressure at the amino-acid level. This kind of error is unlikely because published annotations are scanned for in-frame stop codons and should not happen.
The x-axis scale is the physical position along the bacterial chromosome. This position is express in Kb, that is 1000 bp. Note that chromosome lengths are higly variable, from a small 359 Kb chromosome in Leptospira_interrogans NC_004343 to a large 9,106 Kb chromosome in Bradyrhizobium_japonicum NC_004463, so that between species comparisons should be done with care because there could be one order of magnitude of difference between the quantity of information present between two graphs.
As a rule of thumb, note that in most bacteria (if we exclude some special cases such as Mycobacterium leprae with an atypical low gene density) there is one coding sequence every Kb along the chromosome, so that the map position in Kb is to a good approximation the CDS rank along the chromosome.
With few exceptions such as Borrelia burgdorferi NC_001318, Agrobacterium tumefaciens NC_003063 NC_003305, Streptomyces coelicolor NC_003888, Streptomyces avermitilis NC_003155, most bacterial chromosomes are circular. The graphic should therefore understood as just one among many possible flat representation of a cylindrical one. There is a priori no reason to put the origin of the x-axis at a given position of the chromosome. The animation just below shows what's happen when the x-axis origin is moved along the chromosome (corresponding to a circular permutation of the linearized sequence).
Note, however, that an informal rule for circular chromosomes is to start
the published linearized sequence
at the origin of replication (either known or putative), yielding typical
V-shaped curves such as in
Bacillus anthracis
NC_003997,
Brucella melitensis
NC_003317,
Chlorobium tepidum
NC_002932,
Clostridium perfringens
NC_003366,
Enterococcus faecalis
NC_004668,
Lactobacillus plantarum
NC_004567,
Leptospira interrogans
NC_004342,
Listeria monocytogenes
NC_003210,
Mycobacterium leprae
NC_002677,
Oceanobacillus iheyensis
NC_004193,
Prochlorococcus marinus
NC_005042,
Pseudomonas syringae
NC_004578,
Pyrococcus furiosus
NC_003413,
Ralstonia solanacearum
NC_003295,
Rickettsia prowazekii
NC_000963,
Shewanella oneidensis
NC_004347,
Staphylococcus aureus
NC_002745,
Streptococcus agalactiae
NC_004368,
Synechococcus sp
NC_005070,
Thermoanaerobacter tengcongensis
NC_003869,
Thermoplasma volcanium
NC_002689,
Treponema pallidum
NC_000919,
Tropheryma whipplei
NC_004551,
Vibrio cholerae
NC_002505,
Wolinella succinogenes
NC_005090,
Xanthomonas citri
NC_003919,
Xylella fastidiosa
NC_004556.
This convention is not universal and there are sometimes good reasons not to
start the published sequence at the origin of replication of the chromosome:
when the chromosome is linear, for instance, but also for historical reasons
such as starting the Escherichia coli chromosome
(NC_004431
NC_000913
NC_002695
NC_002655)
at the locus first transferred in the interrupted mating experiments of Jacob and Wollman which funded bacterial chromosome cartography, so that the origin of replication is located
about 1000 Kb before the end of the published sequences.
Oriloc jumps along the chromosome on a coding sequence by coding sequence basis, so that there is one point every Kb on average. The position used in practice for graphics is the midpoint position between the start codon and the stop codon for each coding sequence.
The y-axis scale is more complex because we have four curves with only three of them sharing a common scale. In the following, the four curves are exemplified with the Borrelia burgdorferi chromosome, so that it is wise to open the corresponding graph in a separate window to follow the text, even if regular links are given again in due place. If you want to open the Borrelia burgdorferi chromosome example in a new window, click here. Here are the few things to have in mind about Borrelia burgdorferi genome: this is a short (911 Kb) linear chromosome whose replication origin has been experimentally mapped at the centre of the chromosome, at 458 Kb (Picardeau et al. 1999). This is the first example of a bacterial replication origin that has been predicted from genome structure analysis, and then successfully challenged experimentally. The 5' and the 3' end of the sequence corresponds to the left and the right telomere of the chromosome, respectively.
Let's start with the green curve which has its own scale as given on the right of the figure. This curve represents the coding sequence orientation bias. When the coding sequence is in the direct orientation, that is when the sense strand is 5'->3' in the published strand, we move one unit up. When the coding sequence is in the inverse orientation, that is when the sense strand is 5'->3' in the complementary strand, we move one unit down. Therefore, a positive slope in the green curve means that there is an excess of coding sequences in the direct orientation, and a negative slope that there is an excess of coding sequences in the reverse orientation.
For the Borrelia burgdorferi chromosome example
(NC_001318)
we have a V-shaped curve pointing down at the origin of replication at the centre
of the chromosome. From the left telomere to the origin the slope is globally
negative, meaning that there is an excess of coding sequences in the reverse
orientation. The lowest value is about -150 so that there are, from the left
telomere to the origin, 150 more coding sequences in the reverse orientation
than in the direct one. Since there are about one coding sequence every Kb
in bacteria, the total number of coding sequences is close to 450. If d
denotes the number of coding sequences in the direct orientation, and
r the number of coding sequences in the reverse orientation,
we have then in the left region of the chromosome: d + r = 450
and d - r = -150, so that d = 150 and
r = 300. We can express this as the ratio d/r = 0.5
saying that on average for one coding sequence in the direct orientation there
are two coding sequences in the reverse orientation, or by the ratio
d/(d + r) = 0.33 saying that only
one third of the coding sequences are in the direct orientation. From the
origin of replication to the right telomere, the situation is inverted:
a positive slope with an intensity roughly equal in terms of absolute value
to what was observed on the left half of the chromosome (so that the green
curve ends with a value close to zero). We have therefore just to swap d
and r values for the interpretation: on the right half of the
chromosome on average we have for two coding sequences in the direct orientation
only one in the reverse orientation, or, in other words, 2/3 of the coding
sequences are in the direct orientation.
The general trend, a negative slope before the origin and positive one after,
is not without local deviations. For instance, close to 800 Kb there is a
small (say 50 Kb) region with a negative slope in a region where a global
positive slope is observed. This just means that locally the general trend
is not followed.
The published 5'->3' sequence corresponds from the left telomere to the origin of replication to the lagging strand for replication, and from the origin to the right telomere to the leading strand for replication. Because the two strands are complementary we can summarize the whole picture by saying that in Borrelia burgdorferi chromosome there is an excess of coding sequences with their sense strand in the leading strand for replication (about 2/3 of coding sequences have their sense strand in the leading strand for replication).
How general is this coupling between transcription and replication orientation in bacteria? Anything can happen, from a very strong an homogeneous signal as in Lactococcus lactis NC_002662 to a weak fuzzy signal as in Haemophilus influenzae NC_000907, or even the apparent lack of global structure as in Thermosynechococcus elongatus NC_004113. In bacteria there is a local coupling of coding sequence orientation due to the operon structure that enforces two coding sequences belonging to a same operon to have the same orientation, so that an influence of the average operon length in a genome on the smoothness of the green curve is expected.
The underlying reason of this coupling between transcription and replication orientation in some bacterial genomes is not fully understood and is the subject of current research interest.
Consider the segment of the published sequence corresponding to the first coding sequence (either in the direct or inverse orientation). Keep only bases corresponding to third codon positions and count them (always on the published strand). Let's say we have 100 A and 60 T, then the contribution of this coding sequence to the T-A skew is given by 100 - 60 = +40. We are going to move by +40 units on the y-axis when passing over this coding sequence. A positive slope means therefore that there are on average more T than A, and a negative slope that there are more A than T. Note that the difference T-A is an absolute skew and not a relative skew (often expressed as the ratio (A-T)/(A+T) as in Lobry 1996) and there is a good reason for this: we want here to combine the T-A and C-G skews and therefore keep their absolute contributions so as to weigth the final combined skew by the amount of information available.
For the Borrelia burgdorferi chromosome example (NC_001318) we have a V-shaped curve pointing down at the origin of replication at the centre of the chromosome. The lowest value is at about -25 Kb on the y-axis, meaning that from the left telomere to the origin of replication there are 25,000 more T than A in third codon positions. At a coding sequence scale, since there are about 450 coding sequences in this portion of the chromosome, in one coding sequence there are 55 more T than A. After the origin, the slope just changes its sign (the red curve ends with a value close to zero) meaning that we have a symmetrical situtation with 25,000 more A than T.
The published 5'->3' sequence corresponds from the left telomere to the origin of replication to the lagging strand for replication, and from the origin to the right telomere to the leading strand for replication. Because the two strands are complementary we can summarize the whole picture by saying that in Borrelia burgdorferi chromosome there are 50,000 more T than A in third codon positions when counting bases on the leading strand for replication (nb the sense strand of coding sequences could be either in the leading strand or in the lagging strand of replication, so that base composition in third codon position in the sense strand of coding sequences is highly influenced by the orientation the coding sequence with respect to replication).
How general is this enrichment of T over A in third codon positions in the leading strand of bacterial genomes? This is certainly not general, for instance this is true in Bacillus subtilis NC_000964 and Bacillus halodurans NC_002570 but not in Bacillus cereus NC_004722 and in Bacillus anthracis NC_003997.
The underlying reason of this enrichment of T over A bases in the leading strang in some bacterial genomes is not fully understood and is the subject of current research interest. The most likely underlying mechanism is a mutational bias because the skew is enhanced in weakly selected positions. That's incentally why Oriloc focus on third codon positions so as to increase the signal/noise ratio.
Consider the segment of the published sequence corresponding to the first coding sequence (either in the direct or inverse orientation). Keep only bases corresponding to third codon positions and count them (always on the published strand). Let's say we have 100 C and 60 G, then the contribution of this coding sequence to the C-G skew is given by 100 - 60 = +40. We are going to move by +40 units on the y-axis when passing over this coding sequence. A positive slope means therefore that there are on average more C than G, and a negative slope that there are more G than C. Note that the difference C-G is an absolute skew and not a relative skew (often expressed as the ratio (C-G)/(C+G) as in Lobry 1996) and there is a good reason for this: we want here to combine the C-G and T-A skews and therefore keep their absolute contributions so as to weigth the final combined skew by the amount of information available.
For the Borrelia burgdorferi chromosome example (NC_001318) we have a Λ-shaped curve pointing up at the origin of replication at the centre of the chromosome. The highest value is at about +10 Kb on the y-axis, meaning that from the left telomere to the origin of replication there are 10,000 more C than G in third codon positions. At a coding sequence scale, since there are about 450 coding sequences in this portion of the chromosome, in one coding sequence there are 22 more C than G. After the origin, the slope just changes its sign (the blue curve ends with a value close to zero) meaning that we have a symmetrical situtation with 10,000 more G than C.
The published 5'->3' sequence corresponds from the left telomere to the origin of replication to the lagging strand for replication, and from the origin to the right telomere to the leading strand for replication. Because the two strands are complementary we can summarize the whole picture by saying that in Borrelia burgdorferi chromosome there are 20,000 more G than C in third codon positions when counting bases on the leading strand for replication (nb the sense strand of coding sequences could be either in the leading strand or in the lagging strand of replication, so that base composition in third codon position in the sense strand of coding sequences is highly influenced by the orientation the coding sequence with respect to replication).
How general is this enrichment of G over C in third codon positions in
the leading strand of bacterial genomes? Once upon the time it was though
as being universal (in the sense that iff there is a bias, then the
bias is always such that there are more G than C in the leading strand
for replication). There are indeed many examples of such an orientation
of the GC skew, such as in
Agrobacterium tumefaciens
NC_003063
NC_003305,
Bacillus anthracis
NC_003997,
Bacillus cereus
NC_004722,
Bacillus halodurans
NC_002570,
Bacillus subtilis
NC_000964,
Bacteroides thetaiotaomicron
NC_004663,
Blochmannia floridanus
NC_005061,
Bordetella bronchiseptica
NC_002927,
Bordetella parapertussis
NC_002928,
Bordetella pertussis
NC_002929,
Borrelia burgdorferi
NC_001318,
Bradyrhizobium japonicum
NC_004463,
Brucella melitensis
NC_003317,
Brucella suis
NC_004310,
Buchnera aphidicola
NC_004545
NC_004061,
Buchnera sp
NC_002528,
Campylobacter jejuni
NC_002163,
Caulobacter crescentus
NC_002696,
Chlamydia muridarum
NC_002620,
Chlamydia trachomatis
NC_000117,
Chlamydophila caviae
NC_003361,
Chlamydophila pneumoniae
NC_002179
NC_000922
NC_002491
NC_005043,
Chlorobium tepidum
NC_002932,
Chromobacterium violaceum
NC_005085,
Clostridium acetobutylicum
NC_003030,
Clostridium perfringens
NC_003366,
Clostridium tetani
NC_004557,
Corynebacterium glutamicum
NC_003450,
Coxiella burnetii
NC_002971,
Enterococcus faecalis
NC_004668,
Escherichia coli
NC_004431
NC_000913
NC_002695
NC_002655,
Fusobacterium nucleatum
NC_003454,
Haemophilus ducreyi
NC_002940,
Helicobacter pylori
NC_000915
NC_000921,
Lactobacillus plantarum
NC_004567,
Lactococcus lactis
NC_002662,
Leptospira interrogans
NC_004342,
Listeria innocua
NC_003212,
Listeria monocytogenes
NC_003210,
Methanosarcina acetivorans
NC_003552,
Mycobacterium bovis
NC_002945,
Mycobacterium leprae
NC_002677,
Mycobacterium tuberculosis
NC_002755
NC_000962,
Neisseria meningitidis
NC_003112,
Nitrosomonas europaea
NC_004757,
Oceanobacillus iheyensis
NC_004193,
Pasteurella multocida
NC_002663,
Photorhabdus luminescens
NC_005126,
Porphyromonas gingivalis
NC_002950,
Pseudomonas aeruginosa
NC_002516,
Pseudomonas putida
NC_002947,
Pseudomonas syringae
NC_004578,
Ralstonia solanacearum
NC_003295,
Rickettsia conorii
NC_003103,
Rickettsia prowazekii
NC_000963,
Salmonella typhi
NC_003198
NC_004631,
Salmonella typhimurium
NC_003197,
Shewanella oneidensis
NC_004347,
Shigella flexneri
NC_004337
NC_004741,
Staphylococcus aureus
NC_003923
NC_002758
NC_002745,
Staphylococcus epidermidis
NC_004461,
Streptococcus agalactiae
NC_004116
NC_004368,
Streptococcus mutans
NC_004350,
Streptococcus pneumoniae
NC_003098
NC_003028,
Streptococcus pyogenes
NC_002737
NC_004070
NC_003485
NC_004606,
Thermoanaerobacter tengcongensis
NC_003869,
Thermoplasma volcanium
NC_002689,
Treponema pallidum
NC_000919,
Vibrio cholerae
NC_002505
NC_002506,
Vibrio parahaemolyticus
NC_004603
NC_004605,
Vibrio vulnificus
NC_004459
NC_004460
NC_005139
NC_005140,
Wolinella succinogenes
NC_005090,
Xanthomonas campestris
NC_003902,
Xanthomonas citri
NC_003919,
Xylella fastidiosa
NC_002488
NC_004556,
Yersinia pestis
NC_003143
NC_004088,
However, the ugly little fact is that in Streptomyces coelicolor the GC
skew is inverted.
The genome is a long (8,668 Kb) linear chromosome with the origin of replication
close to the centre (at 4,300 Kb see
Bentley et al. 2002). From the origin to the right telomere the blue
curve is positive, meaning that there is an excess of C over G in the leading
strand for replication. As pointed to me on Halloween-2003 by Robert H. Baran,
the ugliness is not restricted to Streptomyces coelicolor but is also
clearly visible in
Streptomyces avermitilis
NC_003155.
This is also a long (9,026 Kb) linear chromosome with the origin of replication
shifted 776 Kb away from the centre and toward the right end (at 5,288 Kb see
Ikeda et al. 2001,
Ikeda et al. 2003). Here again, the leading strand for replication is
hideously enriched in C over G. Note that this was not clearly visible in Figure
1A ix:

The underlying reason of this enrichment of G over C bases in the leading strang in some bacterial genomes is not fully understood and is the subject of current research interest. The most likely underlying mechanism is a mutational bias because the skew is enhanced in weakly selected positions. That's incentally why Oriloc focus on third codon positions so as to increase the signal/noise ratio.
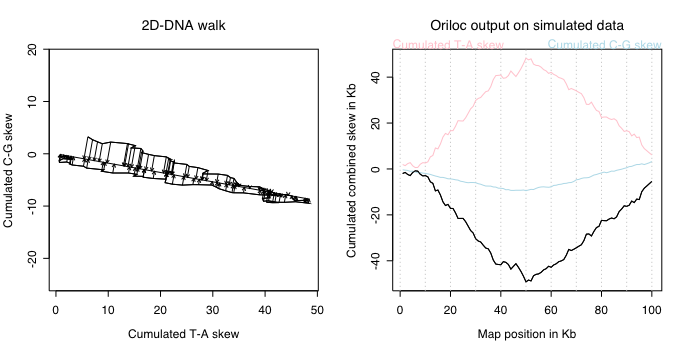
Oriloc tries to combine the signal in the cumulated T-A and C-G absolute skews
while preserving the quantity of information available. In the simulated example
just below, the T-A and C-G skews have a similar intensity.
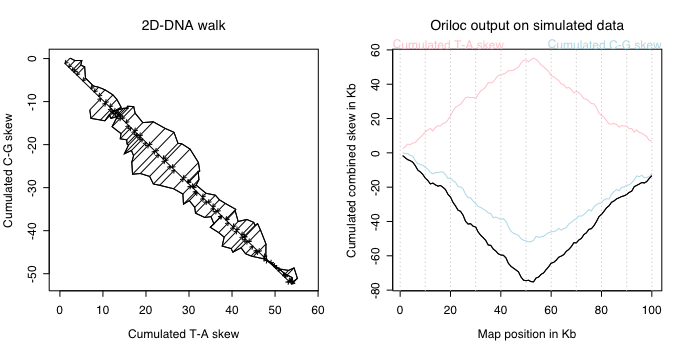 The left pannel shows the 2D-DNA walk obtained when ploting the cumulated C-G skew
versus the T-A one, the general slope is close to 45° in absolute value
because they have a similar intensity. To summarize this 2D-walk into a single
value, Oriloc computes an orthogonal regression line through the origin so as
to project all points on it, as depicted by the arrows. The coordinates on this
regression line are then used to build the cumulated combined skew, that is the
black line on the right pannel. In this case, the ratio of the combined skew to the
individual ones is close to its maximum value: sqrt(2). Units are preserved, the
combined skew is expressed in Kb too.
The left pannel shows the 2D-DNA walk obtained when ploting the cumulated C-G skew
versus the T-A one, the general slope is close to 45° in absolute value
because they have a similar intensity. To summarize this 2D-walk into a single
value, Oriloc computes an orthogonal regression line through the origin so as
to project all points on it, as depicted by the arrows. The coordinates on this
regression line are then used to build the cumulated combined skew, that is the
black line on the right pannel. In this case, the ratio of the combined skew to the
individual ones is close to its maximum value: sqrt(2). Units are preserved, the
combined skew is expressed in Kb too.
Now, suppose that the C-G skew is much more important than the T-A skew,
as in the example just below:
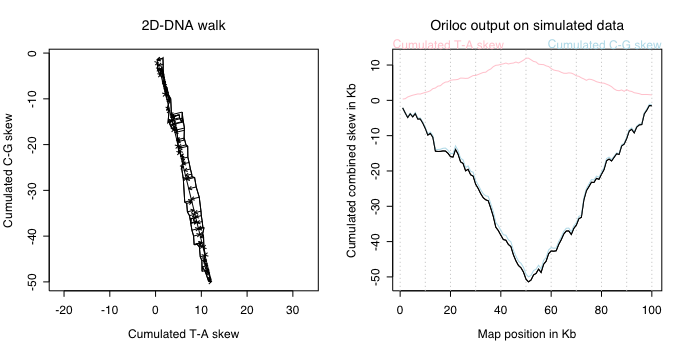 On the left, the slope of the 2D-DNA walk is much more important because all
variations are on the y-axis corresponding to the C-G skew. On the right, note
that the combined skew is very close to the C-G skew, and this is normal because
almost all the signal is coming from the C-G skew.
On the left, the slope of the 2D-DNA walk is much more important because all
variations are on the y-axis corresponding to the C-G skew. On the right, note
that the combined skew is very close to the C-G skew, and this is normal because
almost all the signal is coming from the C-G skew.
What's happen on the other hand when the T-A skew is much more important than
the C-G skew? This is exemplified below:
 On the left, the slope of the 2D-DNA walk is close to zero because all
variations are on the x-axis corresponding to the T-A skew. On the right, note
that the combined skew is very close to the oposite of the T-A skew, and this
is normal because almost all the signal is coming from the T-A skew. Note that
the sign of the combined skew is arbitrary. Oriloc tries to follow the sign
of the C-G skew so that in regular cases the maximum value of the combined
skew correspond to the replication origin, and its lowest value to the terminus
of replication.
On the left, the slope of the 2D-DNA walk is close to zero because all
variations are on the x-axis corresponding to the T-A skew. On the right, note
that the combined skew is very close to the oposite of the T-A skew, and this
is normal because almost all the signal is coming from the T-A skew. Note that
the sign of the combined skew is arbitrary. Oriloc tries to follow the sign
of the C-G skew so that in regular cases the maximum value of the combined
skew correspond to the replication origin, and its lowest value to the terminus
of replication.
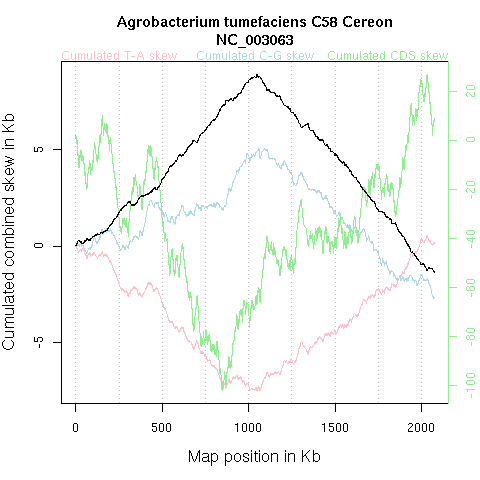
Taking into account simultaneously the T-A and C-G skew is sometimes interesting
to smooth the signal. For example, in Agrobacterium tumefaciens
C58 Cereon NC_003063 depicted below, the combined skew is less fuzzy than
the individual ones: