![]()
![]()
An R Package to read and analyze MetIDQ™ output
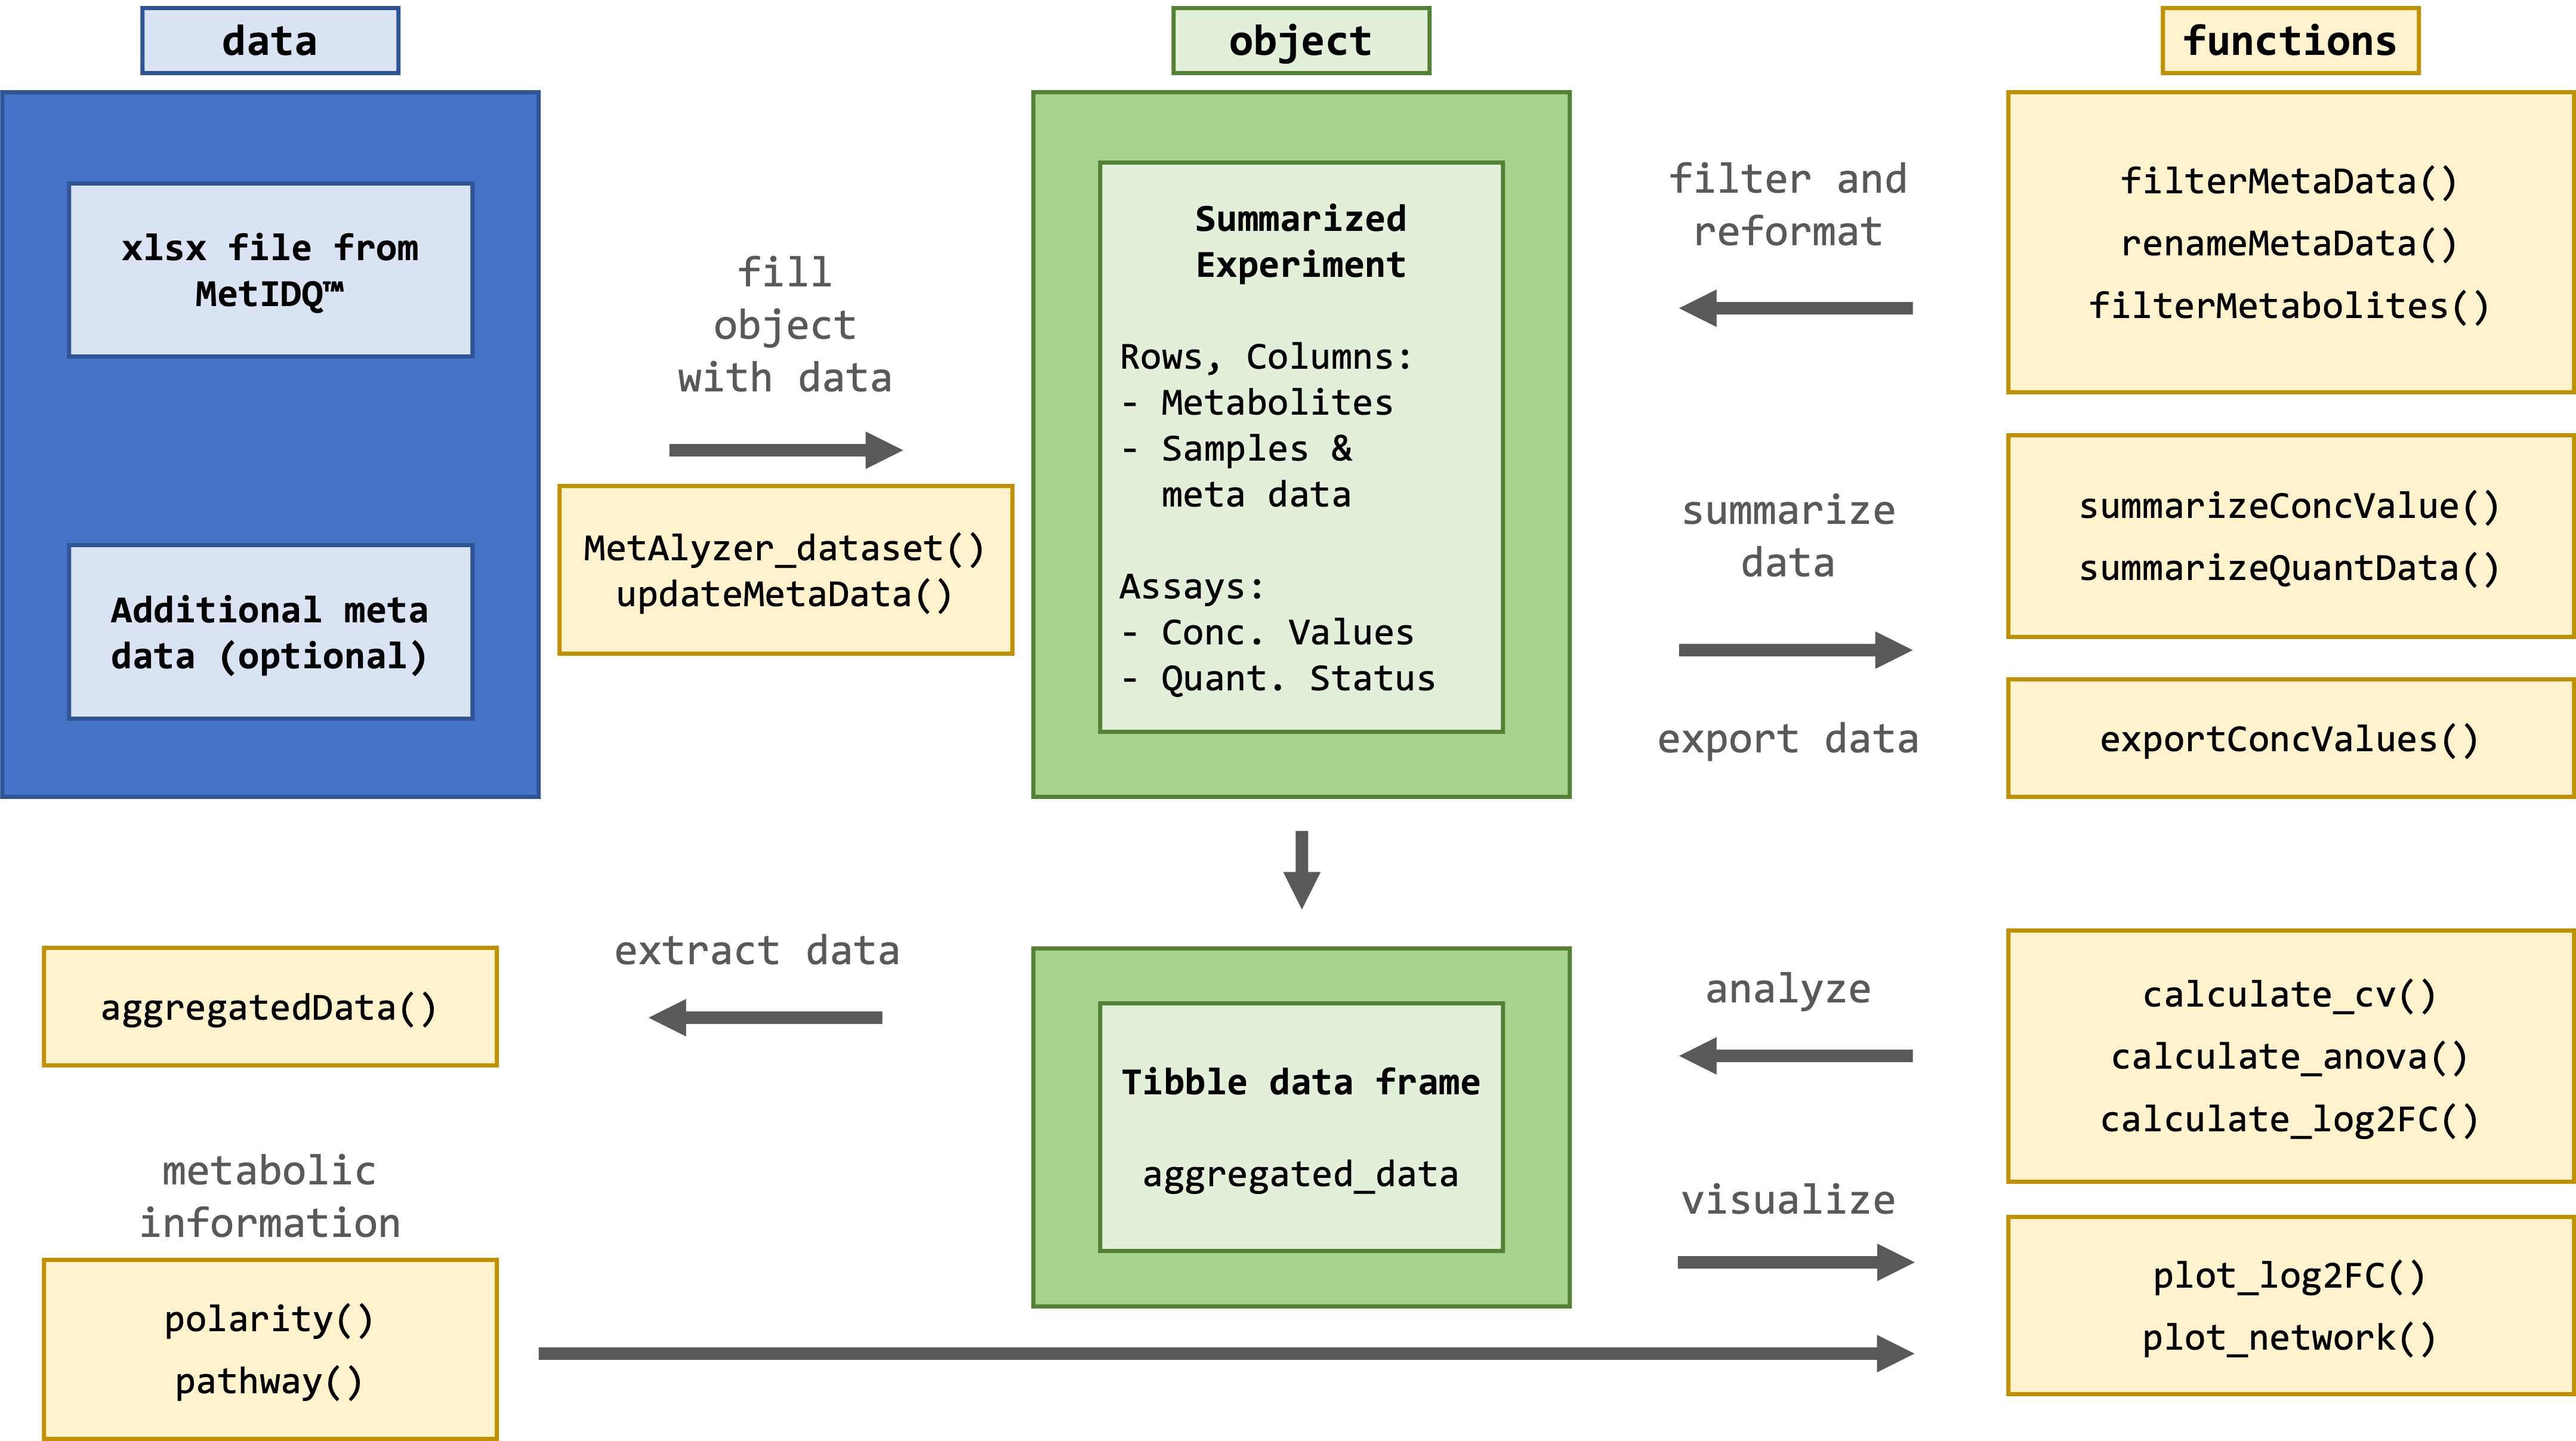
The package provides methods to read output files from the MetIDQ™ software into R. Metabolomics data is read and reformatted into an S4 object for convenient data handling, statistics and downstream analysis.
There is a version available on CRAN.
install.packages("MetAlyzer")For the latest version install from GitHub
library(devtools)
install_github("nilsmechtel/MetAlyzer")The package takes metabolomic measurements and the quantification status (e.g. “Valid”, “LOQ”, “LOD”) as “.xlsx” files generated from the MetIDQ™ software. Additionally, meta data for each sample can be provided for further analysis.
This is an extract from one of the provided example data sets. 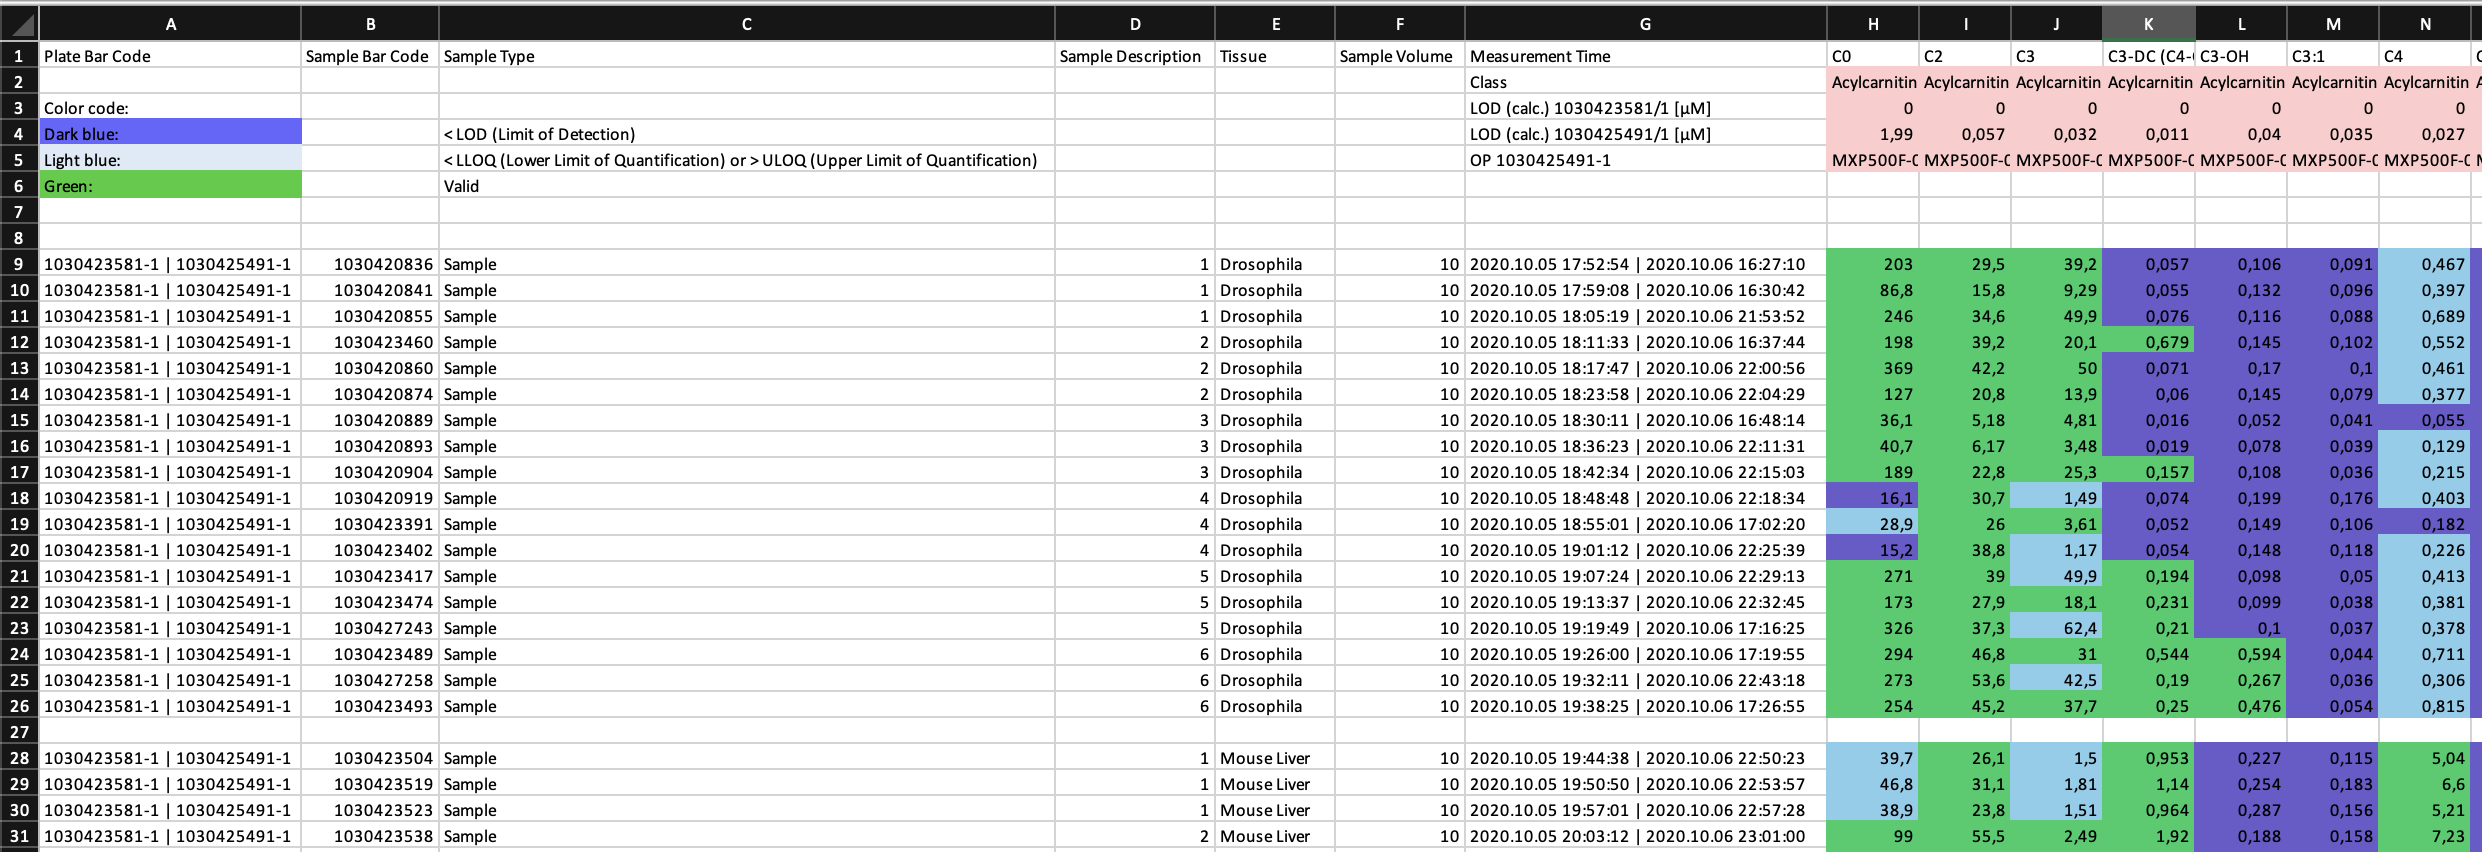
> metalyzer_se <- MetAlyzer_dataset(file_path = extraction_data())


 _____ ______   _______  _________  ________  ___           ___    ___ ________  _______   ________
|\   _ \  _   \|\  ___ \|\___   ___\\   __  \|\  \         |\  \  /  /|\_____  \|\  ___ \ |\   __  \
\ \  \\\__\ \  \ \   __/\|___ \  \_\ \  \|\  \ \  \        \ \  \/  / /\|___/  /\ \   __/|\ \  \|\  \
 \ \  \\|__| \  \ \  \_|/__  \ \  \ \ \   __  \ \  \        \ \    / /     /  / /\ \  \_|/_\ \   _  _\
  \ \  \    \ \  \ \  \_|\ \  \ \  \ \ \  \ \  \ \  \____    \/   / /     /  /_/__\ \  \_|\ \ \  \\  \|
   \ \__\    \ \__\ \_______\  \ \__\ \ \__\ \__\ \_______\__/   / /     |\________\ \_______\ \__\\ _\
    \|__|     \|__|\|_______|   \|__|  \|__|\|__|\|_______|\____/ /       \|_______|\|_______|\|__|\|__|
                                                          \|____|/


Info: Reading color code "FFFFCCCC" as "#FFCCCC"
Info: Reading color code "FF00CD66" as "#00CD66"
Info: Reading color code "FF6A5ACD" as "#6A5ACD"
Info: Reading color code "FF87CEEB" as "#87CEEB"
Info: Reading color code "FFFFFFCC" as "#FFFFCC"

Measured concentration values:
------------------------------
        0%        25%        50%        75%       100%
     0.000      0.017      1.760     21.200 288149.000

NAs: 5348 (8.38%)
Note: 'Metabolism Indicators' are frequently NA!

Measured quantification status:
-------------------------------
Valid: 24095 (37.77%)
LOQ: 5799 (9.09%)
LOD: 21789 (34.16%)
Invalid: 12105 (18.98%)
NAs: 0 (0%)For further filtering, statistical analysis and plotting, the data is reformatted and aggregated into a tibble data frame.
> aggregatedData(metalyzer_se)
# A tibble: 63,788 × 5
# Groups:   Metabolite [862]
   ID    Metabolite Class          Concentration Status
   <fct> <fct>      <fct>                  <dbl> <fct>
 1 9     C0         Acylcarnitines         203   Valid
 2 10    C0         Acylcarnitines          86.8 Valid
 3 11    C0         Acylcarnitines         246   Valid
 4 12    C0         Acylcarnitines         198   Valid
 5 13    C0         Acylcarnitines         369   Valid
 6 14    C0         Acylcarnitines         127   Valid
 7 15    C0         Acylcarnitines          36.1 Valid
 8 16    C0         Acylcarnitines          40.7 Valid
 9 17    C0         Acylcarnitines         189   Valid
10 18    C0         Acylcarnitines          16.1 LOD
# ℹ 63,778 more rows
# ℹ Use `print(n = ...)` to see more rowsFor a comprehensive tutorial, please check out the MetAlyzer Vignette.