


cograph is a modern R package for the analysis and visualization of complex networks, designed for simplicity, tidy outputs, comprehensive statistics and up-to-date network science. cograph accepts matrices, edge lists, and igraph, statnet, qgraph and tna objects without conversion, and offers a wide array of tools for plotting, wrangling, centrality, community detection, motif, robustness, multilayer and higher-order analysis.
# Release version from CRAN
install.packages("cograph")

# Development version from GitHub
# install.packages("remotes")
remotes::install_github("sonsoleslp/cograph")The examples use regulation_net, a synthetic weighted
transition network among ten learning states included in the package.
splot() plots it in one call, and
tna_styling = TRUE applies the visual conventions of
transition networks.
library(cograph)
splot(regulation_net, tna_styling = TRUE)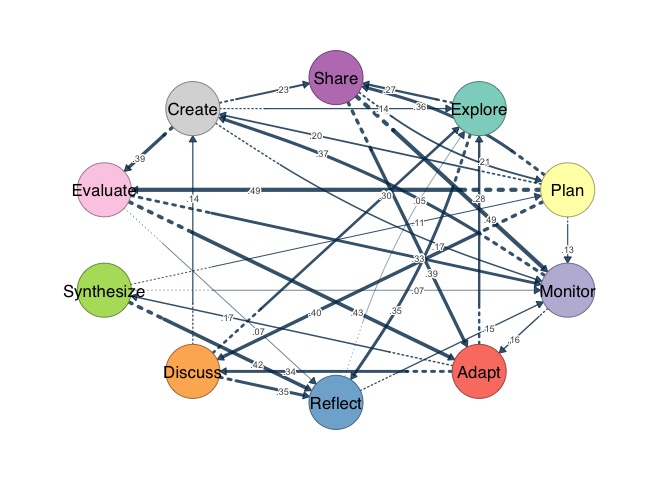
centrality() returns any combination of measures as a
tidy data frame, from the classical measures to recent ones such as
randomized shortest-path betweenness and Trust-PageRank.
centrality(regulation_net,
           measures = c("strength", "betweenness", "pagerank",
                        "rsp_betweenness", "trust_pagerank"),
           sort_by = "pagerank", digits = 3)
#>          node strength_all betweenness pagerank rsp_betweenness trust_pagerank
#> 1     Monitor         1.87        18.0    0.184         132.027          0.147
#> 2      Create         1.64        13.0    0.138         102.913          0.117
#> 3     Reflect         1.39        10.0    0.125          79.405          0.084
#> 4       Adapt         1.77        15.0    0.124          91.887          0.112
#> 5     Explore         1.39         5.0    0.118          79.715          0.086
#> 6       Share         1.95         9.0    0.095          69.907          0.092
#> 7    Evaluate         1.71         3.0    0.074          51.387          0.092
#> 8     Discuss         1.53         0.5    0.068          43.823          0.088
#> 9  Synthesize         0.77         6.5    0.038          23.304          0.067
#> 10       Plan         1.90        15.5    0.036          22.235          0.114
plot_mcml() shows a network whose nodes belong to
clusters as a two-layer hierarchy, with the node-level network below and
the cluster-level network above.
clusters <- list(Cognitive  = c("Explore", "Plan", "Monitor", "Adapt", "Reflect"),
                 Social     = c("Discuss", "Synthesize", "Share"),
                 Evaluative = c("Evaluate", "Create"))
plot_mcml(regulation_net, clusters)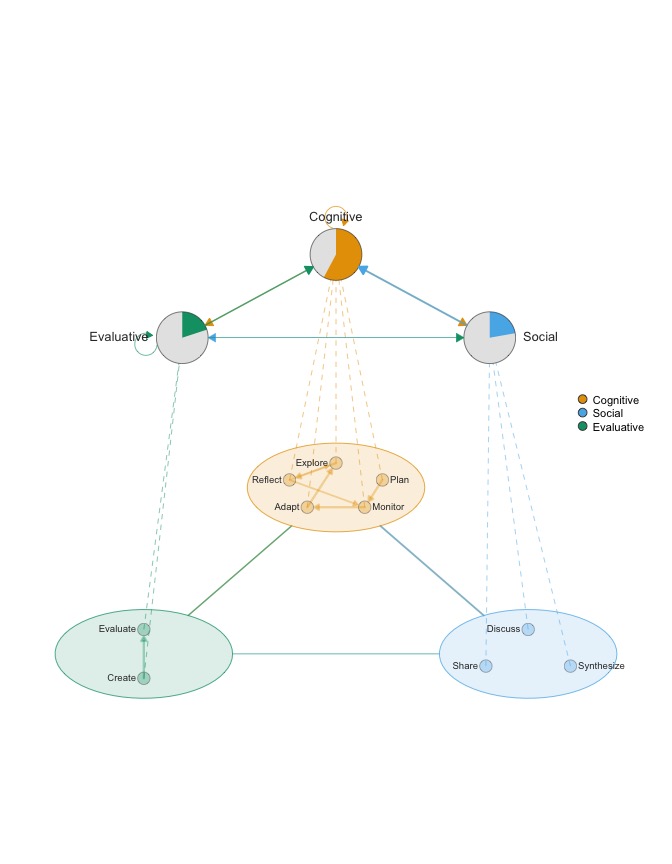
plot_simplicial() visualizes higher-order pathways over
the network, with each pathway joining the states that lead to a target
state.
plot_simplicial(regulation_net,
                c("Explore Plan -> Monitor", "Monitor Adapt -> Reflect",
                  "Discuss Synthesize -> Evaluate", "Create Share -> Explore"))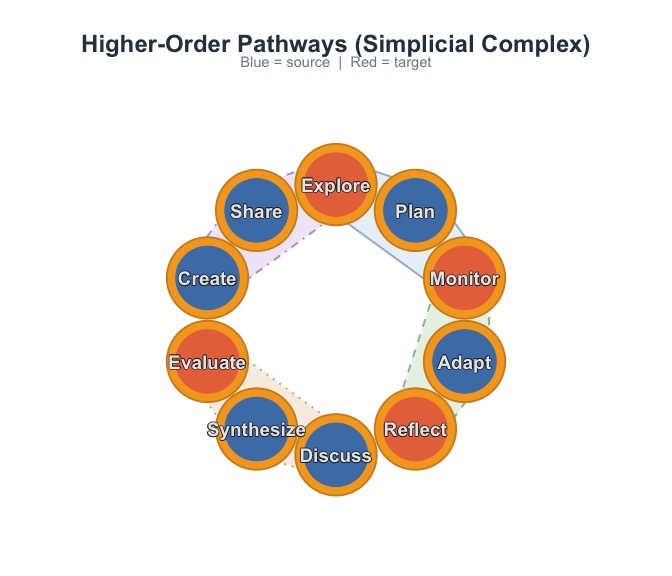
splot() plots any supported input with specialized styling
for transition and psychological networks, alongside a wide array of
specialized plots from alluvial flows and chord diagrams to bootstrap
forest plots and temporal prisms.centrality() returns a large collection of node centrality
measures across all major families as a tidy data frame, tested against
igraph, sna, centiserve, NetworkX and other implementations where they
exist.network_summary() returns density,
diameter, centralization, reciprocity, transitivity and many further
statistics in one data frame.communities() runs a range of detection algorithms through
one call, with consensus, comparison and significance testing of
partitions.motifs() and subgraphs() count the triads of
the MAN classification, test their frequencies and identify the nodes
that form each pattern.robustness() and vulnerability() simulate
targeted and random attacks and measure each node’s contribution to the
efficiency of the network.Tutorials
splot().plot_mcml().Articles
Please cite cograph with citation("cograph"). cograph is
released under the MIT license.