
![]()


![]()
Simple Principal Components Analysis (PCA; see
vignette("pca")) and (Multiple) Correspondence Analysis
(CA) based on the Singular Value Decomposition (SVD). This package
provides S4 classes and methods to compute, extract, summarize and
visualize results of multivariate data analysis. It also includes
methods for partial bootstrap validation.
There are many very good packages for multivariate data analysis (such as FactoMineR, ade4, vegan or ca, all extended by FactoExtra). dimensio is designed to be as simple as possible, providing all the necessary tools to explore the results of the analysis.
To cite dimensio in publications use:
Frerebeau N (2026). dimensio: Multivariate Data Analysis. Université Bordeaux Montaigne, Pessac, France. doi:10.5281/zenodo.4478530 https://doi.org/10.5281/zenodo.4478530. R package version 0.14.2, https://packages.tesselle.org/dimensio/.
This package is a part of the tesselle project https://www.tesselle.org.
You can install the released version of dimensio from CRAN with:
install.packages("dimensio")And the development version from Codeberg with:
# install.packages("remotes")
remotes::install_git("https://codeberg.org/tesselle/dimensio")## Load package
library(dimensio)## Load data
data(iris)
## Compute PCA
X <- pca(iris, center = TRUE, scale = TRUE, sup_quali = "Species")dimensio provides several methods to extract the results:
get_data() returns the original data.get_contributions() returns the contributions to the
definition of the principal dimensions.get_coordinates() returns the principal or standard
coordinates.get_correlations() returns the correlations between
variables and dimensions.get_cos2() returns the cos2 values (i.e. the
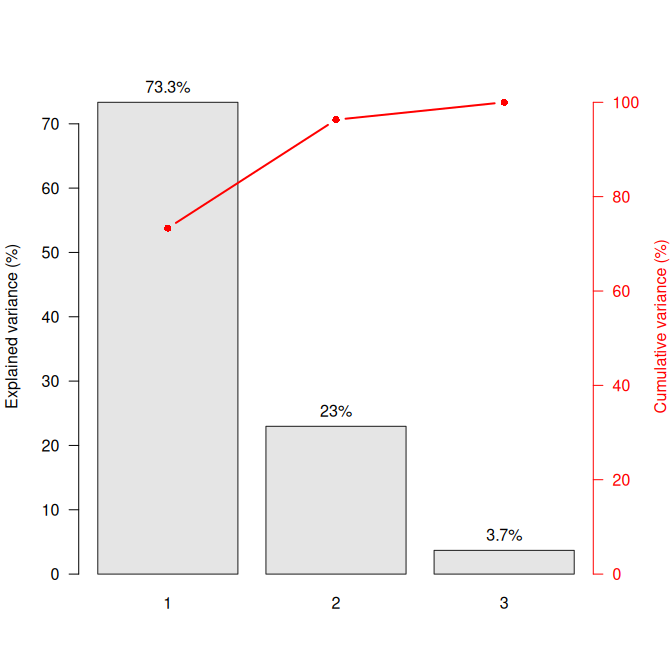
quality of the representation of the points on the factor map).get_eigenvalues() returns the eigenvalues, the
percentages of variance and the cumulative percentages of variance.The package allows to quickly visualize the results:
biplot() produces a biplot.screeplot() produces a scree plot.viz_rows()/viz_individuals() displays
row/individual principal coordinates.viz_columns()/viz_variables() displays
columns/variable principal coordinates. viz_variables()
depicts the variables by rays emanating from the origin (both their
lengths and directions are important to the interpretation).viz_contributions() displays (joint)
contributions.viz_cos2() displays (joint) cos2.The viz_*() functions allow to highlight additional
information by varying different graphical elements (color,
transparency, shape and size of symbols…).
## Form biplot
biplot(X, type = "form")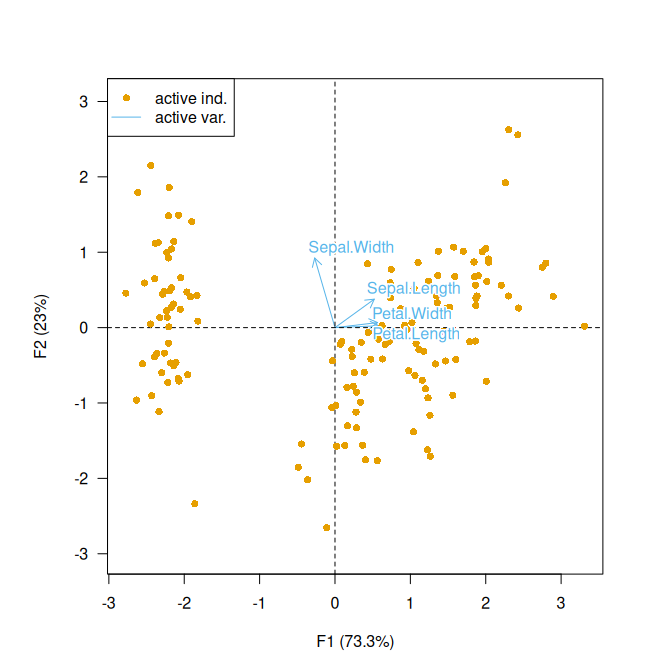
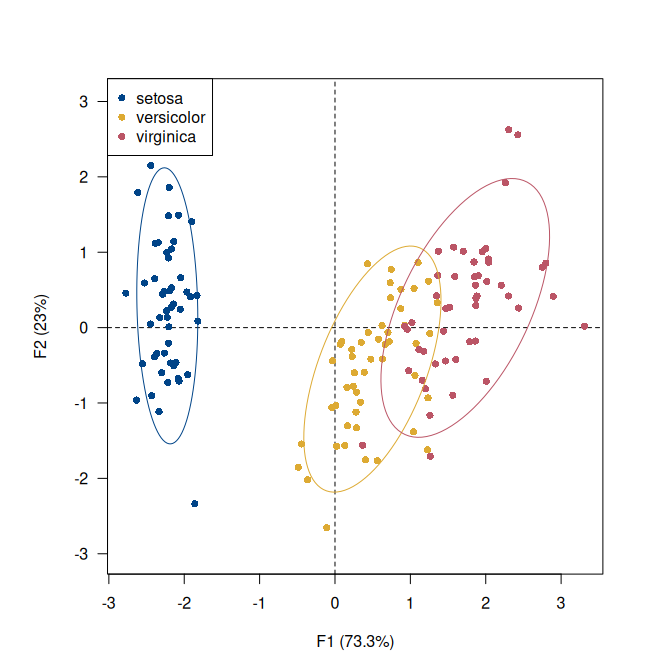
## Highlight species
viz_individuals(
x = X,
extra_quali = iris$Species,
color = c("#004488", "#DDAA33", "#BB5566"),
ellipse = list(type = "tolerance", level = 0.95) # Add ellipses
)
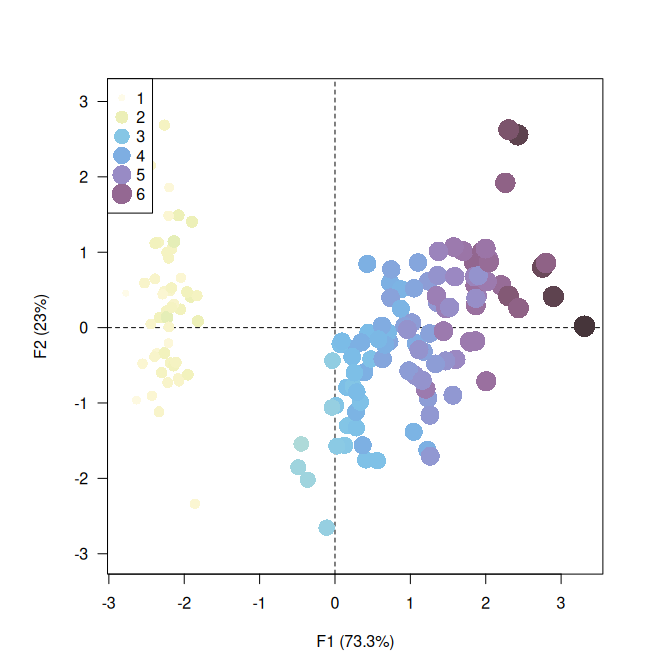
## Highlight petal length
viz_individuals(
x = X,
extra_quanti = iris$Petal.Length,
color = color("iridescent")(255),
size = c(1, 3)
)
## Plot variables factor map
viz_variables(X)

## Scree plot
screeplot(X, eigenvalues = FALSE, cumulative = TRUE)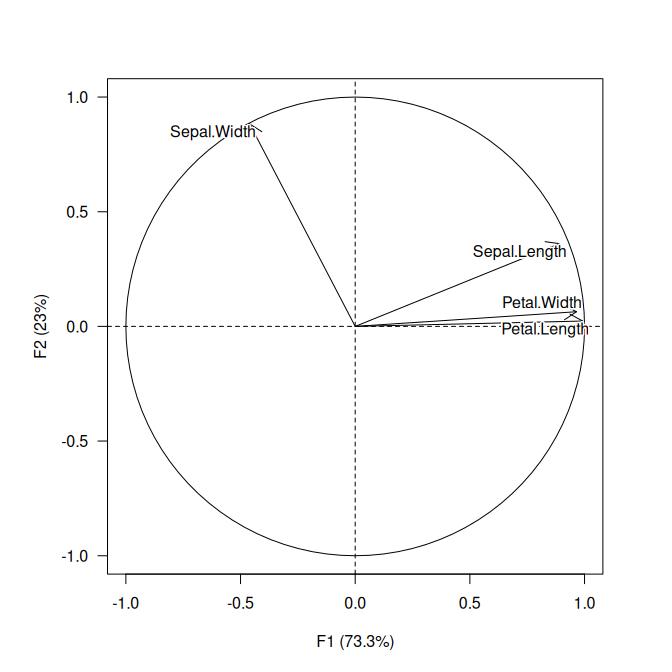
This package provides translations of user-facing communications,
like messages, warnings and errors, and graphical elements (axis
labels). The preferred language is by default taken from the locale.
This can be overridden by setting of the environment variable
LANGUAGE (you only need to do this once per session):
Sys.setenv(LANGUAGE = "<language code>")Languages currently available are English (en) and
French (fr).
Please note that the dimensio project is released with a Contributor Code of Conduct. By contributing to this project, you agree to abide by its terms.