![]()
⌚️ A faster
unique()function
You can install the released version of funique from Github with:
## install remotes pkg if not already
if (!requireNamespace("remotes", quietly = TRUE)) {
  install.packages("remotes")
}

## install funique from github
remotes::install_github("mkearney/funique")There’s one function funique(), which is the same as
base::unique() only optimized to be faster when data
contain date-time variables.
funique() vs. base::unique()The code below creates a data frame with several duplicate rows and
then compares performance (in time) of funique() versus
base::unique().
## set seed
set.seed(20180812)
## generate data
d <- data.frame(
x = rnorm(1000),
y = seq.POSIXt(as.POSIXct("2018-01-01"),
as.POSIXct("2018-12-31"), length.out = 10))
## create data frame with duplicate rows
d <- d[c(1:1000, sample(1:1000, 500, replace = TRUE)), ]
row.names(d) <- NULL
## check the output against base::unique
identical(unique(d), funique(d))
#> [1] TRUE
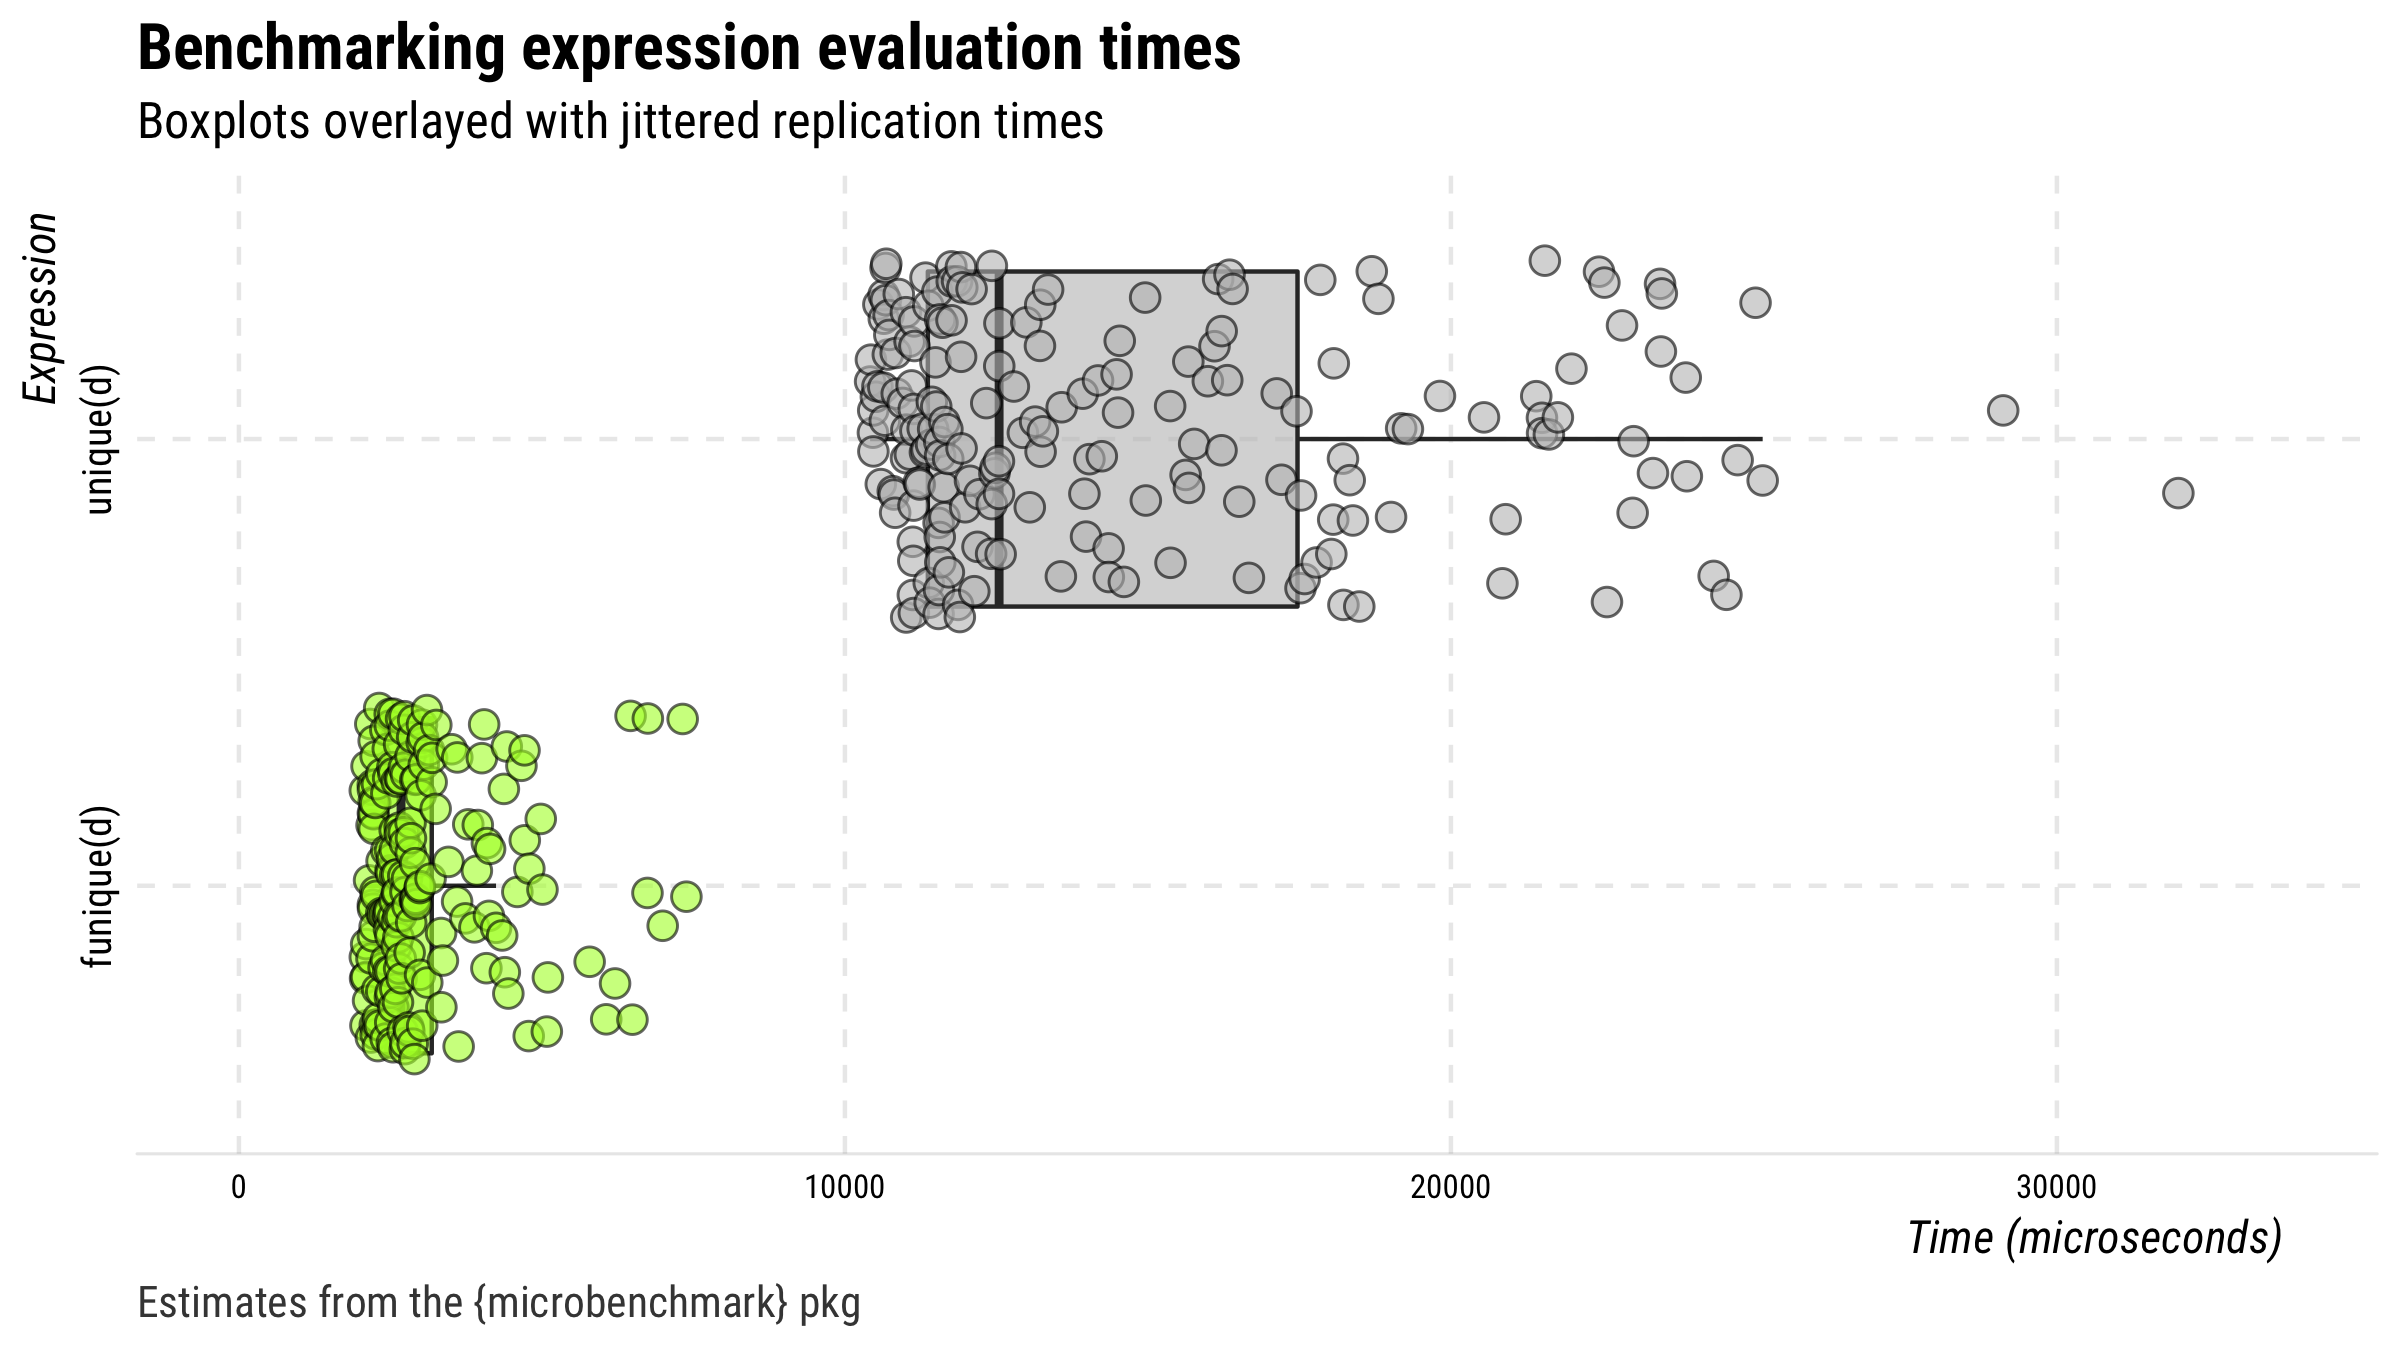
## bench mark
(m <- microbenchmark::microbenchmark(unique(d), funique(d),
times = 200, unit = "relative"))
#> Unit: relative
#> expr min lq mean median uq max neval
#> unique(d) 4.98663 4.92073 4.94704 5.14552 5.38573 2.02836 200
#> funique(d) 1.00000 1.00000 1.00000 1.00000 1.00000 1.00000 200
## plot
plot(drop_hl(m, n = 4)) +
ggplot2::ggsave("man/figures/r1.png", width = 8, height = 4.5, units = "in")
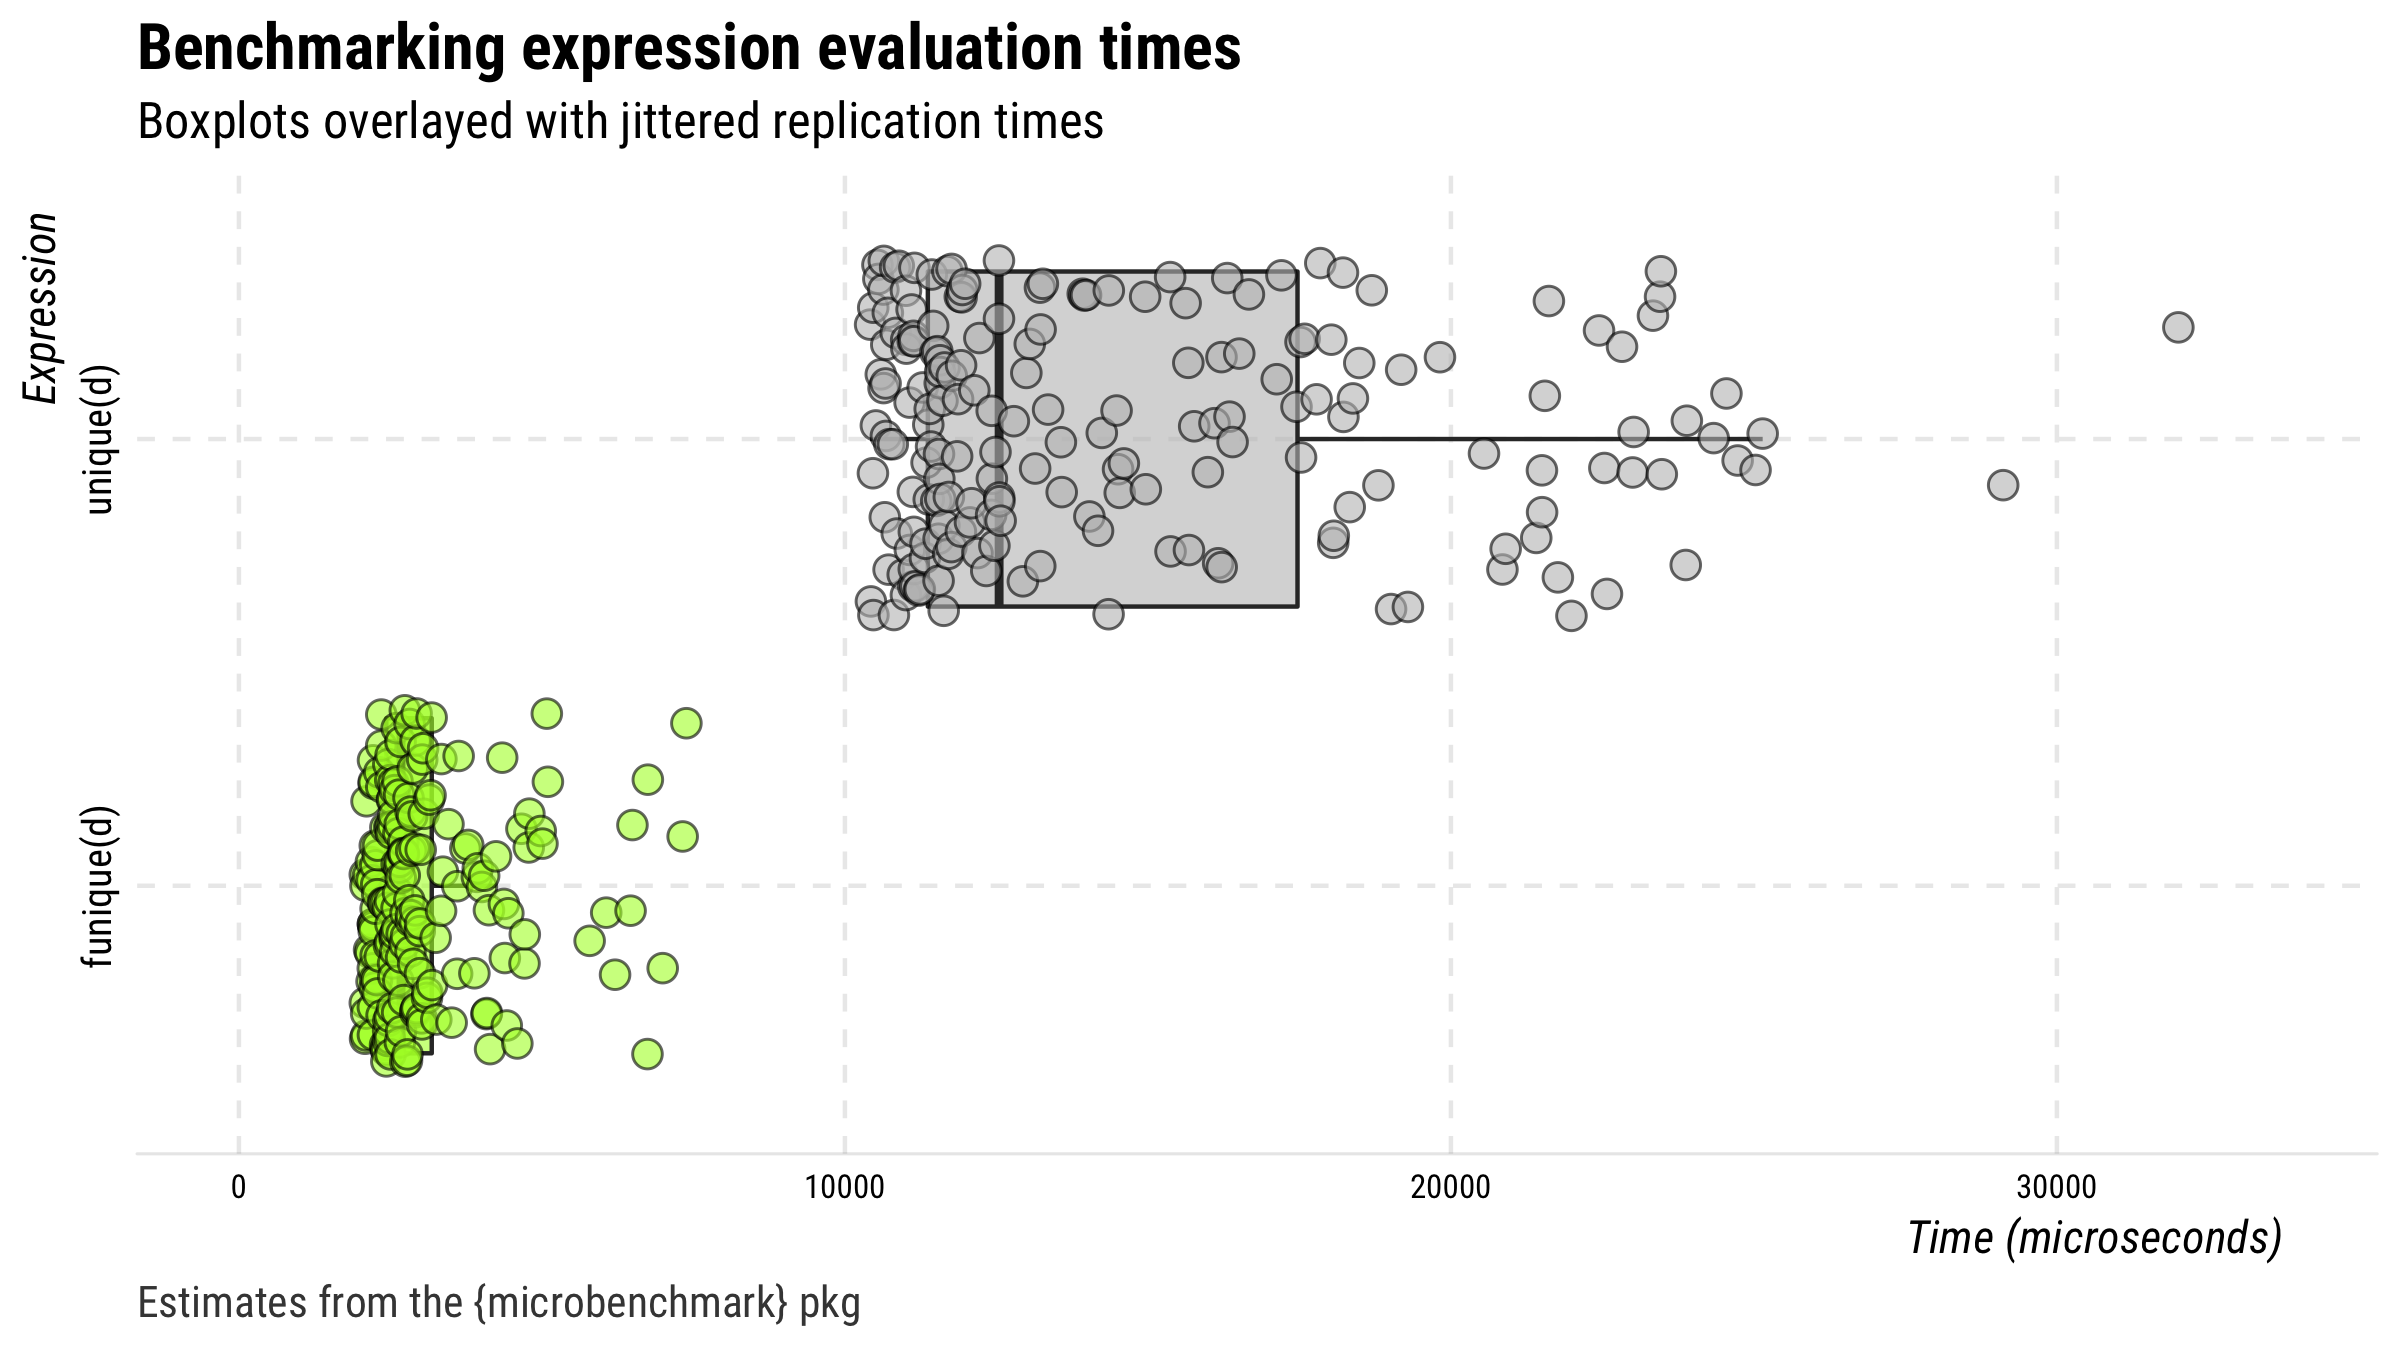
Here’s another test this time using duplicate-infested Twitter data.
## search for data on 100 tweets
rt <- rtweet::search_tweets("lang:en", verbose = FALSE)

## create duplicates
rt2 <- rt[sample(1:nrow(rt), 1000, replace = TRUE), ]

## benchmarks
(mb <- microbenchmark::microbenchmark(
  unique(rt2), funique(rt2), unit = "relative"))
#> Unit: relative
#>          expr     min      lq    mean median      uq      max neval
#>   unique(rt2) 1.56861 1.57622 1.35692 1.5524 1.35336 0.393617   100
#>  funique(rt2) 1.00000 1.00000 1.00000 1.0000 1.00000 1.000000   100

## make sure the output is the same
identical(unique(rt2), funique(rt2))
#> [1] TRUE

## plot
plot(drop_hl(m, n = 4)) +
  ggplot2::ggsave("man/figures/r2.png", width = 8, height = 4.5, units = "in")