
![]()
![]()
![]()
The goal of ‘ggspectra’ is to make it easy to plot radiation spectra and similar data, such and transmittance, absorbance and reflectance spectra, producing fully annotated publication- and presentation-ready plots. It is an extension to packages ‘ggplot2’ and ‘photobiology’, and part of the ‘r4photobiology’ suite.
Package ‘ggspectra’ provides stats, geoms, scales and functions to be used for plotting radiation-related spectra and annotating the plots with quantities derived from spectral data. All summary quantities implemented in ‘photobiology’ can be used for annotations including biologically effective irradiances and exposures.
Please, see the web page The R for Photobiology Suite for an overview of the component packages.
Plotting spectra with an specialization of the
autoplot() method provides the most automatic approach. The
specializations provided support the classes defined in package
‘photobiology’, both for individual spectra and for collections of
spectra.
library(ggspectra)
autoplot(sun.spct)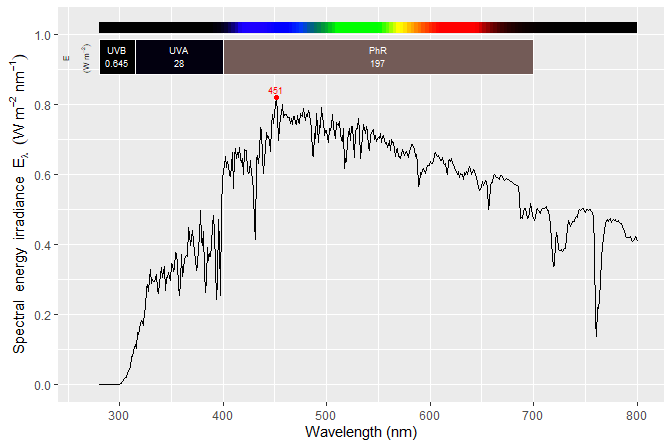
Some degree of flexibility can be obtained by passing arguments.
autoplot(sun.spct, annotations = c("+", "title:where:when"), unit.out = "photon")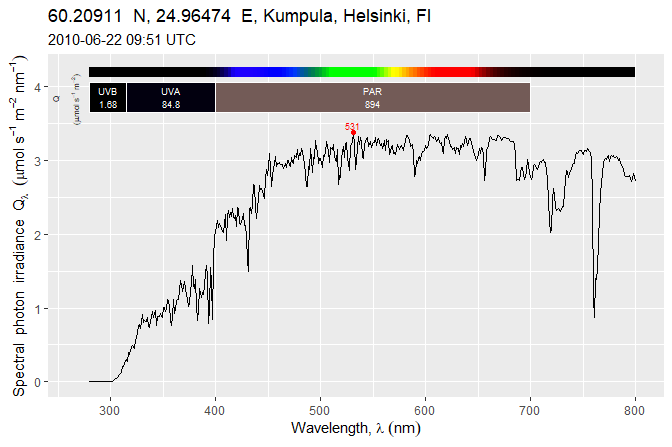
Maximum flexibility is achieved when building a plot layer by layer
using the grammar of graphics approach, as implemented in ‘ggplot2’, but
taking advantage of the specialized ggplot() methods,
geometries, statistics and scales specialized
for the plotting of spectra, defined in this package. Although designed
with the classes defined from package ‘photobiology’ in mind,
geometries, statistics and scales can also be used with data stored in
other formats, as long as the user pays attention to the expected units
and bases of expression expected.
ggplot(sun.spct, unit.out = "photon") +
  geom_spct() +
  scale_y_s.q.irrad_continuous() +
  scale_x_wl_continuous(sec.axis = sec_axis_w_number()) +
  theme_bw()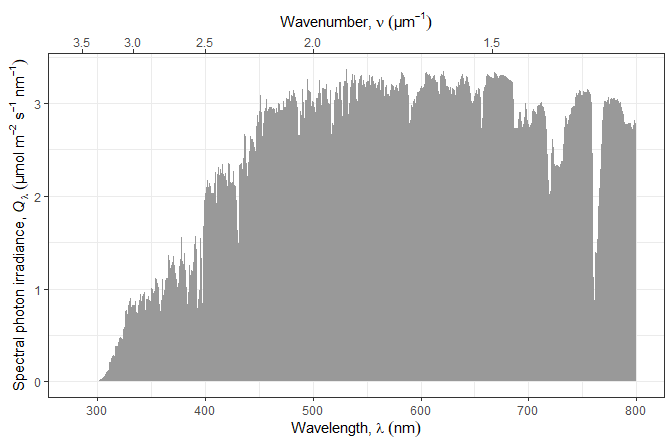
Installation of the most recent stable version from CRAN:
install.packages("ggspectra")Installation of the current unstable version from GitHub:
# install.packages("remotes")
remotes::install_github("aphalo/ggspectra")HTML documentation is available at (https://docs.r4photobiology.info/ggspectra/), including additional on-line-only articles.
News on updates to the different packages of the ‘r4photobiology’ suite are regularly posted at (https://www.r4photobiology.info/).
Two articles introduce the basic ideas behind the design of the suite and its use: Aphalo P. J. (2015) (https://doi.org/10.19232/uv4pb.2015.1.14) and Aphalo P. J. (2016) (https://doi.org/10.19232/uv4pb.2016.1.15).
A book is under preparation, and the draft is currently available at (https://leanpub.com/r4photobiology/). The book contains many examples of plots created with ‘ggspectra’.
A handbook written before the suite was developed contains useful information on the quantification and manipulation of ultraviolet and visible radiation: Aphalo, P. J., Albert, A., Björn, L. O., McLeod, A. R., Robson, T. M., & Rosenqvist, E. (Eds.) (2012) Beyond the Visible: A handbook of best practice in plant UV photobiology (1st ed., p. xxx + 174). Helsinki: University of Helsinki, Department of Biosciences, Division of Plant Biology. ISBN 978-952-10-8363-1 (PDF), 978-952-10-8362-4 (paperback). PDF file available from (https://doi.org/10.31885/9789521083631).
Pull requests, bug reports, and feature requests are welcome at (https://github.com/aphalo/ggspectra).
If you use this package to produce scientific or commercial publications, please cite according to:
citation("ggspectra")
#> To cite package ‘photobiology’ in publications use:
#>
#>   Aphalo, Pedro J. (2015) The r4photobiology suite. UV4Plants Bulletin,
#>   2015:1, 21-29. DOI:10.19232/uv4pb.2015.1.14
#>
#> A BibTeX entry for LaTeX users is
#>
#>   @Article{,
#>     author = {Pedro J. Aphalo},
#>     title = {The r4photobiology suite},
#>     journal = {UV4Plants Bulletin},
#>     volume = {2015},
#>     number = {1},
#>     pages = {21-29},
#>     year = {2015},
#>     doi = {10.19232/uv4pb.2015.1.14},
#> }© 2015-2026 Pedro J. Aphalo (pedro.aphalo@helsinki.fi). Released under the GPL, version 2 or greater. This software carries no warranty of any kind.