![]()
![]()
![]()
![]()
The roahd (Robust Analysis of High-dimensional Data) package allows to use a set of statistical tools for the exploration and robustification of univariate and multivariate functional datasets through the use of depth-based statistical methods.
In the implementation of functions, special attention was put to their efficiency, so that they can be profitably used also for the analysis of high-dimensional datasets.
For a full-featured description of the package, please take a look at the roahd vignette.
Install the released version of roahd from CRAN:
install.packages("roahd")Or install the development version from GitHub with:
# install.packages("remotes")
remotes::install_github("astamm/roahd")
fData
and mfData
objectsA simple S3 representation of functional data object, fData,
allows to encapsulate the important features of univariate functional
datasets (like the grid of the dependent variable, the pointwise
observations, etc.):
library(roahd)

# Grid representing the dependent variable
grid = seq( 0, 1, length.out = 100 )

# Pointwise measurements of the functional dataset
Data = matrix( c( sin( 2 * pi * grid ),
                  cos ( 2 * pi * grid ),
                  sin( 2 * pi * grid + pi / 4 ) ), ncol = 100, byrow = TRUE )

# S3 object encapsulating the univariate functional dataset
fD = fData( grid, Data )

# S3 representation of a multivariate functional dataset
mfD = mfData( grid, list( 'comp1' = Data, 'comp2' = Data ) )
Also, this allows to exploit simple calls to customized functions which simplifies the exploratory analysis:
# Algebra of fData objects
fD + 1 : 100
fD * 4

fD + fD

# Subsetting fData objects (providing other fData objects)
fD[ 1, ]
fD[ 1, 2 : 4]

# Sample mean and (depth-based) median(s)
mean( fD )
mean( fD[ 1, 10 : 20 ] )
median_fData( fD, type = 'MBD' )
# Plotting functions
plot( fD )
plot( mean( fD ), lwd = 4, add = TRUE )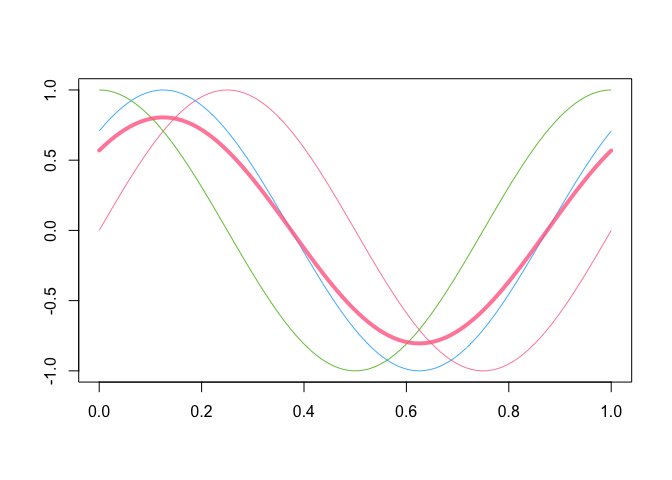
plot( fD[ 2:3, ] )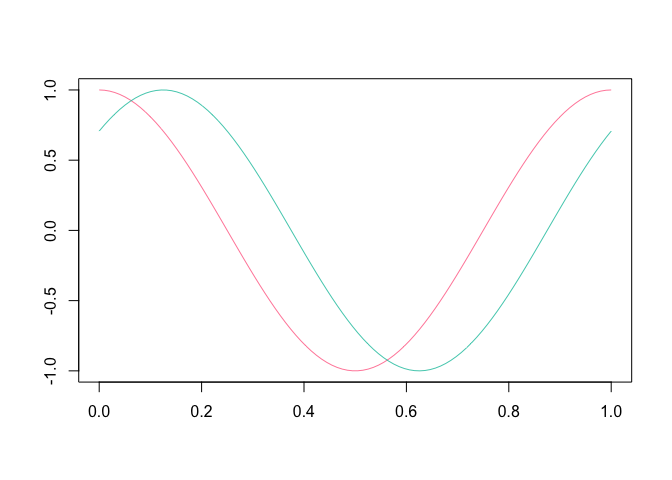
A part of the package is specifically devoted to the computation of depths and other statistical indices for functional data:
These also are the core of the visualization / robustification tools
like functional boxplot (fbplot)
and outliergram (outliergram),
allowing the visualization and identification of amplitude and shape
outliers.
Thanks to the functions for the simulation of synthetic functional
datasets, both fbplot
and outliergram
procedures can be auto-tuned to the dataset at hand, in order to control
the true positive outliers rate.
If you use this package for your own research, please cite the corresponding R Journal article:
To cite roahd in publications use:

  Ieva, F., Paganoni, A. M., Romo, J., & Tarabelloni, N. (2019). roahd
  Package: Robust Analysis of High Dimensional Data. The R Journal,
  11(2), pp. 291-307.

A BibTeX entry for LaTeX users is

  @Article{,
    title = {{roahd Package: Robust Analysis of High Dimensional Data}},
    author = {Francesca Ieva and Anna Maria Paganoni and Juan Romo and Nicholas Tarabelloni},
    journal = {{The R Journal}},
    year = {2019},
    volume = {11},
    number = {2},
    pages = {291--307},
    url = {https://doi.org/10.32614/RJ-2019-032},
  }