sasfunclust

 The package
sasfunclust implements the sparse and smooth functional clustering
(SaS-Funclust) method proposed by Centofanti et al. (2021). SaS-Funclust
is a new method for clustering functional data that aims to classify a
sample of curves into homogeneous groups while jointly detecting the
most informative portions of domain. The method relies on a general
functional Gaussian mixture model whose parameters are estimated by
maximizing a log-likelihood function penalized with the functional
adaptive pairwise fusion penalty (FAPFP) and a roughness penalty. The
package comprises two main functions and . The former performs the
SaS-Funclust for fixed number of clusters G, tuning parameter
of the smoothness penalty λs, and tuning
parameter of the FAPFP λl. The latter
executes the K-fold cross-validation procedure described in Centofanti
et al. (2021) to choose G, λs, and
λl.
The package
sasfunclust implements the sparse and smooth functional clustering
(SaS-Funclust) method proposed by Centofanti et al. (2021). SaS-Funclust
is a new method for clustering functional data that aims to classify a
sample of curves into homogeneous groups while jointly detecting the
most informative portions of domain. The method relies on a general
functional Gaussian mixture model whose parameters are estimated by
maximizing a log-likelihood function penalized with the functional
adaptive pairwise fusion penalty (FAPFP) and a roughness penalty. The
package comprises two main functions and . The former performs the
SaS-Funclust for fixed number of clusters G, tuning parameter
of the smoothness penalty λs, and tuning
parameter of the FAPFP λl. The latter
executes the K-fold cross-validation procedure described in Centofanti
et al. (2021) to choose G, λs, and
λl.
Installation
The development version can be installed from GitHub with:
# install.packages("devtools")
devtools::install_github("unina-sfere/sasfunclust")
Example
This is a basic example which shows you how to apply the two main
functions sasfclust and sasfclust_cv on a
synthetic dataset generated as described in the simulation study of
Centofanti et al. (2021).
We start by loading and attaching the sasfunclust package.
Then, we generate the synthetic dataset as follows.
n_i=20
train<-simulate_data("Scenario I",n_i=n_i,var_e = 1,var_b = 0.5^2)
To apply sasfclust_cv, sequences of G,
λs, and λl
should be defined.
lambda_s_seq=10^seq(-4,-3)
lambda_l_seq=10^seq(0,3)
G_seq=2
And, then, sasfclust_cv is executed.
mod_cv<-sasfclust_cv(X=train$X,grid=train$grid,G_seq=G_seq,
lambda_l_seq = lambda_l_seq,lambda_s_seq =lambda_s_seq,maxit = 50,K_fold = 5,q=30,ncores = 7)
The results are plotted.
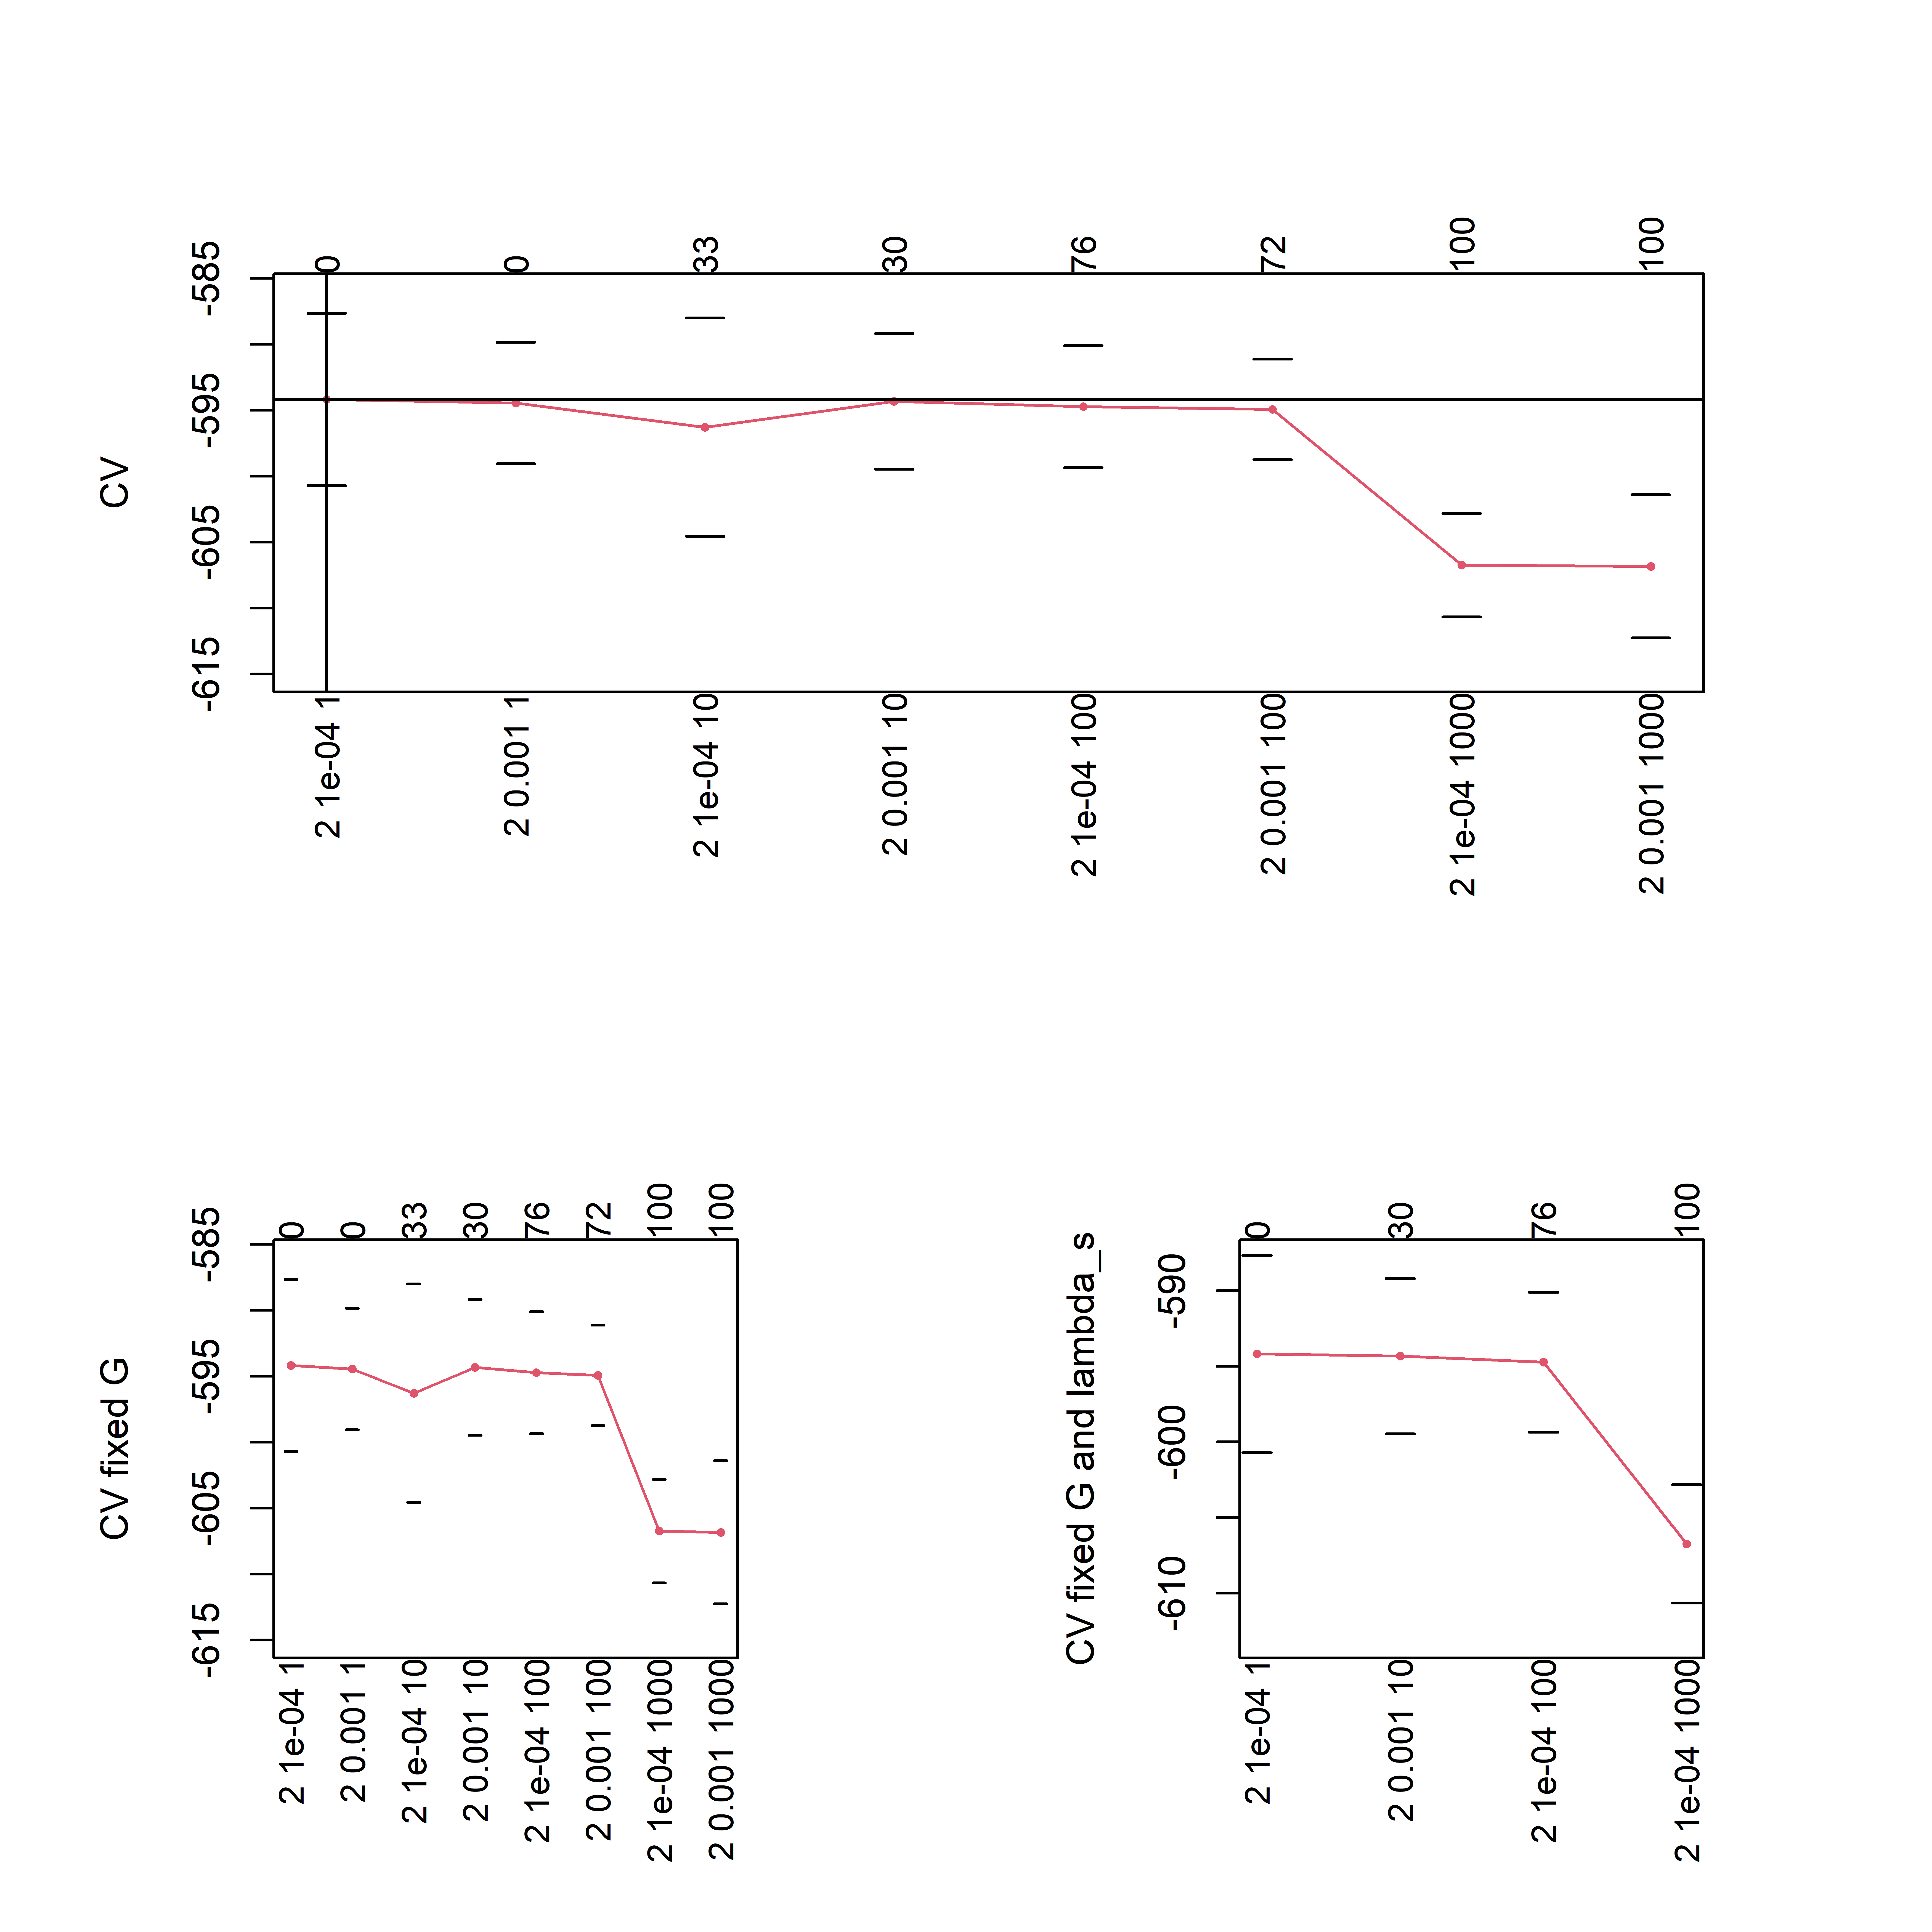 By using the model selection method described in Centofanti et
al. (2021), the optimal values of G,
λs, and λl,
are 2, 10 − 4, and 102, respectively.
By using the model selection method described in Centofanti et
al. (2021), the optimal values of G,
λs, and λl,
are 2, 10 − 4, and 102, respectively.
Finally, sasfclust is applied with G,
λs, and λl
fixed to their optimal values.
mod<-sasfclust(X=train$X,grid=train$grid,G=mod_cv$G_opt,
lambda_l = mod_cv$lambda_l_opt,lambda_s =mod_cv$lambda_s_opt,maxit = 50,q=30)
The cluster membership vector and the plot of the estimated cluster
mean functions and the classified curves are obtained as follows.
print(mod$clus$classes)
plot(mod)

References
- Centofanti, F., Lepore, A., & Palumbo, B. (2021). Sparse and
Smooth Functional Data Clustering. arXiv preprint
arXiv:2103.15224.