![]()
![]()

![]()
![]()
![]()
![]()
![]()
This package is available on CRAN.
Use this R package to download, navigate and analyse the Student-Life dataset. The Student-Life dataset contains passive and automatic sensing data from the phones of a class of 48 de-identified Dartmouth college students. It was collected over a 10 week term. Additionally, the dataset contains Ecological Momentary Assessment results along with pre- and post-study mental health surveys, such as the PHQ-9. The intended use is to allow researchers and other interested people to assess mental health, academic performance and behavioral trends. The raw dataset and additional information is available at https://studentlife.cs.dartmouth.edu/.
## Uncomment to install the package from CRAN
# install.packages("studentlife")

## Or, uncomment to install the package from GitHub
# install.packages("devtools")
# devtools::install_github("frycast/studentlife")
This studentlife repository includes a small sample dataset that can be used for practice and testing. You can download the sample data within R:
library(studentlife)
d <- tempdir()
download_studentlife(location = d, url = "testdata")
This README will use the studentlife data in its original format. Details on the full original dataset are available here. However, an RData version of the dataset has been hosted on Zenodo as of 09/11/2019 here. To download and use this RData version (which is faster to read and takes up less space):
d <- tempdir()
download_studentlife(location = d, url = "rdata")

# Choose the schema and table from the list SL_tables:
SL_tables

# Example with activity table from sensing schema
schema <- "sensing"
table <- "activity"
act <- readRDS(paste0(d, "/dataset_rds/", schema, "/", table, ".Rds"))
act
In this README we will use the full dataset rather than just the sample data. The download size is 5 GB.
download_studentlife(location = d)Use the interactive menu to browse the tables and schemas of the downloaded dataset:
tab <- studentlife::load_SL_tibble(location = d)The object returned by the above function is called a ‘StudentLife
tibble’ (or SL_tbl). Restrictions can be placed on the menu
options with time_options:
tab_t <- load_SL_tibble(location = d, time_options = "timestamp", csv_nrows = 10)
tab_p <- load_SL_tibble(location = d, time_options = "interval" , csv_nrows = 10)
tab_d <- load_SL_tibble(location = d, time_options = "dateonly" , csv_nrows = 10)
tab_s <- load_SL_tibble(location = d, time_options = "dateless" , csv_nrows = 10)
The regularise_time function can be used to summarise
information within blocks of time, producing an object called a
‘regularised StudentLife tibble’ (or reg_SL_tbl):
tab <- load_SL_tibble(
  loc = d, schema = "sensing", table = "activity", csv_nrows = 10)

regularise_time(
  tab, blocks = c("day","weekday"),
  act_inf = max(activity_inference), add_NAs = FALSE)
Produce a histogram showing PAM EMA response frequencies over the course of the study:
tab_PAM <- load_SL_tibble(schema = "EMA", table = "PAM", location = d)
response_hour_hist(tab_PAM, break_hours = 10)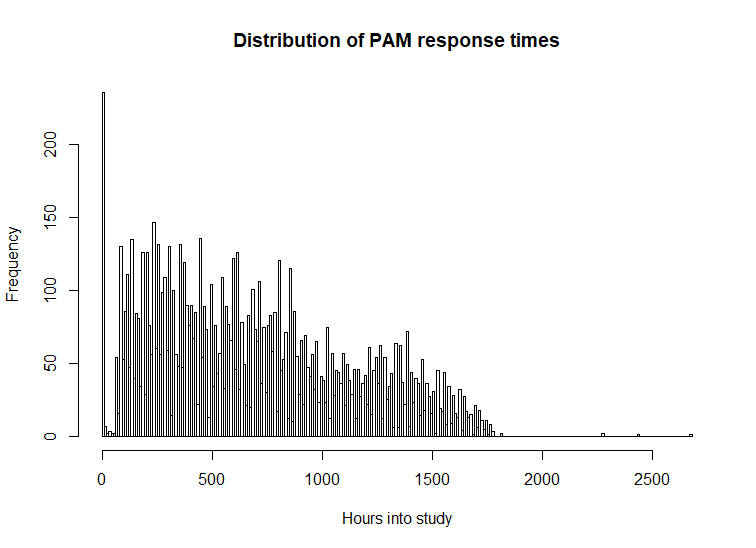
A summary will produce details such as EMA question, UIDs of dropped students, schema name, table name, and summary statistics.
summary(tab_PAM)EMA_questions
Refer to: Pollak, J. P., Adams, P., & Gay, G. (2011, May).
PAM: a photographic affect meter for frequent, in situ measurement of affect.
In Proceedings of the SIGCHI conference on Human factors in computing systems
(pp. 725-734). ACM.
dropped_students
None
column_names
picture_idx timestamp uid
schema
EMA
table
PAM
Skim summary statistics
n obs: 9040
n variables: 3
-- Variable type:factor --------------------------------------------------------
variable missing complete n n_unique top_counts ordered
uid 0 9040 9040 49 59: 437, 0: 390, 19: 384, 57: 377 FALSE
-- Variable type:numeric -------------------------------------------------------
variable missing complete n mean sd p0 p25 p50 p75 p100
picture_idx 0 9040 9040 8.85 4.17 1 6 8 12 16
timestamp 0 9040 9040 1.4e+09 1608614.45 1.4e+09 1.4e+09 1.4e+09 1.4e+09 1.4e+09
hist
▂▃▆▇▃▆▅▅
▇▇▆▅▃▁▁▁After regularising a StudentLife tibble, we can visualise the missing values in each block for each student:
reg_PAM <- regularise_time(tab_PAM, blocks = c("day", "epoch"), m = mean(picture_idx, na.rm = TRUE))
vis_NAs(reg_PAM, response = "m")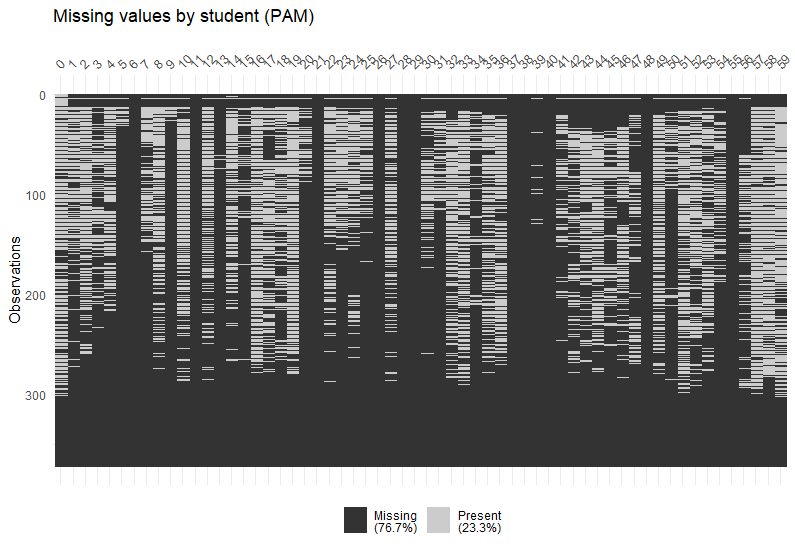
We can also visualise and compare the total number of responses received from each student over the course of the study:
vis_response_counts(reg_PAM, response = "m")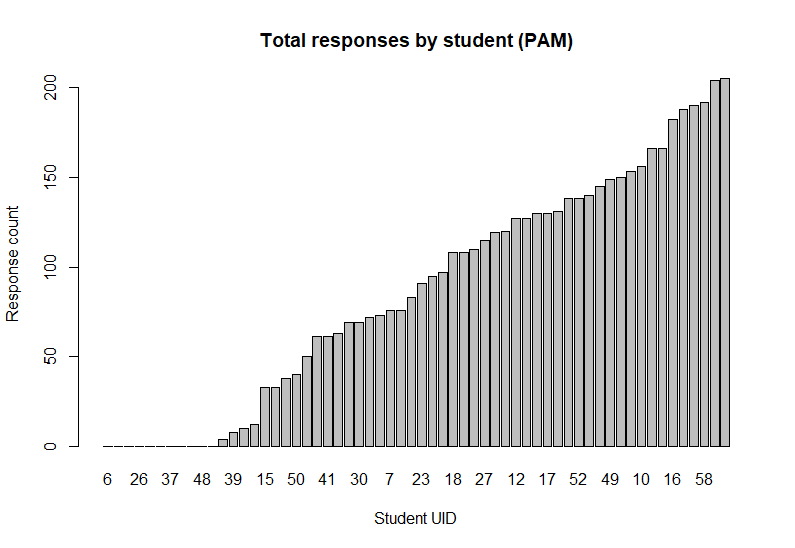
Summaries of survey data are formatted with question information and some answer statistics:
tab_PHQ9 <- load_SL_tibble(loc = d, schema = "survey", table = "PHQ-9")
summary(tab_PHQ9)
time_info
none
survey_questions
Q1: Little interest or pleasure in doing things
Q2: Feeling down, depressed, hopeless.
Q3: Trouble falling or staying asleep, or sleeping too much.
Q4: Feeling tired or having little energy
Q5: Poor appetite or overeating
Q6: Feeling bad about yourself or that you are a failure or have let yourself or your family down
Q7: Trouble concentrating on things, such as reading the newspaper or watching television
Q8: Moving or speaking so slowly that other people could have noticed. Or the opposite being so figety or restless that you have been moving around a lot more than usual
Q9: Thoughts that you would be better off dead, or of hurting yourself
Q10: Response
column_names
uid type Q1 Q2 Q3 Q4 Q5 Q6 Q7 Q8 Q9 Q10
schema
survey
table
PHQ-9
skim
Skim summary statistics
n obs: 84
n variables: 12
-- Variable type:factor --------------------------------------------------------
variable missing complete n n_unique top_counts ordered
Q1 0 84 84 4 Not: 42, Sev: 28, Mor: 10, Nea: 4 FALSE
Q10 5 79 84 4 Som: 37, Not: 36, NA: 5, Ext: 3 FALSE
Q2 0 84 84 4 Not: 40, Sev: 34, Mor: 6, Nea: 4 FALSE
Q3 0 84 84 4 Not: 41, Sev: 25, Mor: 10, Nea: 8 FALSE
Q4 0 84 84 4 Sev: 38, Not: 23, Mor: 17, Nea: 6 FALSE
Q5 0 84 84 4 Sev: 35, Not: 34, Mor: 9, Nea: 6 FALSE
Q6 0 84 84 4 Not: 45, Sev: 27, Mor: 6, Nea: 6 FALSE
Q7 0 84 84 4 Not: 48, Sev: 26, Mor: 7, Nea: 3 FALSE
Q8 0 84 84 4 Not: 64, Sev: 15, Mor: 4, Nea: 1 FALSE
Q9 0 84 84 3 Not: 75, Sev: 6, Mor: 3, NA: 0 FALSE
type 0 84 84 2 pre: 46, pos: 38, NA: 0 FALSE
uid 0 84 84 46 0: 2, 1: 2, 2: 2, 3: 2 FALSEThis studentlife repository includes many automated software tests
implemented via testthat.
We use these to check for bugs before releasing new updates. They can be
found under the directory tests. Also, we use Travis-CI for
continuous integration.