![]()
![]()
![]()
![]()
ypr is
an R package that implements equilibrium-based yield per recruit
methods. Yield per recruit methods can used to estimate the optimal
yield (Walters and Martell 2004) of a fish population with one or more
ecotypes. The yield can be based on the number of fish caught (or
harvested) or biomass for all fish or just large (trophy)
individuals.
The key life history parameters are
k) and mean maximum length
(Linf) from the Von Bertalanffy growth curveLs)Lv)n)Rk)and in the case of ecotypes
RPR)The calculations do not account for stochasticity, predator-prey dynamics, angler responses or density-dependent growth.
To install the latest release from CRAN
install.packages("ypr")To install the developmental version from GitHub
# install.packages("remotes")
remotes::install_github("poissonconsulting/ypr")library(ypr)
population <- ypr_population(Rk = 5, Ls = 50, Rmax = 100, rho = 0.6)
ypr_plot_schedule(population, x = "Length", y = "Spawning")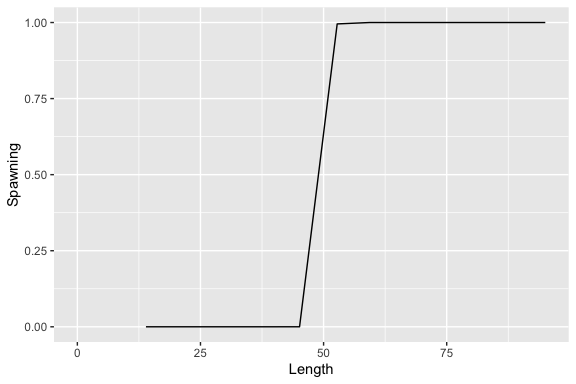
ypr_tabulate_schedule(population)
#> # A tibble: 20 × 11
#> Age Length Weight Fecundity Spawning NaturalMor…¹ Vulner…² Reten…³ Fishin…⁴
#> <int> <dbl> <dbl> <dbl> <dbl> <dbl> <dbl> <dbl> <dbl>
#> 1 1 13.9 27.0 27.0 3.13e-56 0.2 3.13e-56 0.4 2.50e-57
#> 2 2 25.9 174. 174. 2.91e-29 0.2 2.91e-29 0.4 2.33e-30
#> 3 3 36.2 476. 476. 1.04e-14 0.2 1.04e-14 0.4 8.35e-16
#> 4 4 45.1 918. 918. 3.46e- 5 0.2 3.46e- 5 0.4 2.77e- 6
#> 5 5 52.8 1469. 1469. 9.95e- 1 0.2 9.95e- 1 0.4 7.96e- 2
#> 6 6 59.3 2090. 2090. 1.00e+ 0 0.2 1.00e+ 0 0.4 8.00e- 2
#> 7 7 65.0 2747. 2747. 1.00e+ 0 0.2 1.00e+ 0 0.4 8.00e- 2
#> 8 8 69.9 3412. 3412. 1.00e+ 0 0.2 1.00e+ 0 0.4 8.00e- 2
#> 9 9 74.1 4065. 4065. 1 e+ 0 0.2 1 e+ 0 0.4 8 e- 2
#> 10 10 77.7 4689. 4689. 1 e+ 0 0.2 1 e+ 0 0.4 8 e- 2
#> 11 11 80.8 5274. 5274. 1 e+ 0 0.2 1 e+ 0 0.4 8 e- 2
#> 12 12 83.5 5816. 5816. 1 e+ 0 0.2 1 e+ 0 0.4 8 e- 2
#> 13 13 85.8 6310. 6310. 1 e+ 0 0.2 1 e+ 0 0.4 8 e- 2
#> 14 14 87.8 6758. 6758. 1 e+ 0 0.2 1 e+ 0 0.4 8 e- 2
#> 15 15 89.5 7160. 7160. 1 e+ 0 0.2 1 e+ 0 0.4 8 e- 2
#> 16 16 90.9 7518. 7518. 1 e+ 0 0.2 1 e+ 0 0.4 8 e- 2
#> 17 17 92.2 7836. 7836. 1 e+ 0 0.2 1 e+ 0 0.4 8 e- 2
#> 18 18 93.3 8116. 8116. 1 e+ 0 0.2 1 e+ 0 0.4 8 e- 2
#> 19 19 94.2 8363. 8363. 1 e+ 0 0.2 1 e+ 0 0.4 8 e- 2
#> 20 20 95.0 8580. 8580. 1 e+ 0 0.2 1 e+ 0 0.4 8 e- 2
#> # … with 2 more variables: Survivorship <dbl>, FishedSurvivorship <dbl>, and
#> # abbreviated variable names ¹NaturalMortality, ²Vulnerability, ³Retention,
#> # ⁴FishingMortality
#> # ℹ Use `colnames()` to see all variable namesypr_plot_fish(population, color = "white")
ypr_tabulate_fish(population)
#> # A tibble: 20 × 8
#> Age Survivors Spawners Caught Harvested Released HandlingMortal…¹ Ecotype
#> <dbl> <dbl> <dbl> <dbl> <dbl> <dbl> <dbl> <chr>
#> 1 1 70.1 2.19e-54 4.39e-55 1.76e-55 2.63e-55 0 <NA>
#> 2 2 56.1 1.63e-27 3.26e-28 1.30e-28 1.96e-28 0 <NA>
#> 3 3 44.9 4.68e-13 9.36e-14 3.74e-14 5.62e-14 0 <NA>
#> 4 4 35.9 1.24e- 3 2.48e- 4 9.93e- 5 1.49e- 4 0 <NA>
#> 5 5 28.7 2.86e+ 1 5.72e+ 0 2.29e+ 0 3.43e+ 0 0 <NA>
#> 6 6 21.1 2.11e+ 1 4.23e+ 0 1.69e+ 0 2.54e+ 0 0 <NA>
#> 7 7 15.6 1.56e+ 1 3.11e+ 0 1.24e+ 0 1.87e+ 0 0 <NA>
#> 8 8 11.5 1.15e+ 1 2.29e+ 0 9.16e- 1 1.37e+ 0 0 <NA>
#> 9 9 8.43 8.43e+ 0 1.69e+ 0 6.74e- 1 1.01e+ 0 0 <NA>
#> 10 10 6.20 6.20e+ 0 1.24e+ 0 4.96e- 1 7.44e- 1 0 <NA>
#> 11 11 4.57 4.57e+ 0 9.13e- 1 3.65e- 1 5.48e- 1 0 <NA>
#> 12 12 3.36 3.36e+ 0 6.72e- 1 2.69e- 1 4.03e- 1 0 <NA>
#> 13 13 2.47 2.47e+ 0 4.95e- 1 1.98e- 1 2.97e- 1 0 <NA>
#> 14 14 1.82 1.82e+ 0 3.64e- 1 1.46e- 1 2.18e- 1 0 <NA>
#> 15 15 1.34 1.34e+ 0 2.68e- 1 1.07e- 1 1.61e- 1 0 <NA>
#> 16 16 0.986 9.86e- 1 1.97e- 1 7.89e- 2 1.18e- 1 0 <NA>
#> 17 17 0.726 7.26e- 1 1.45e- 1 5.81e- 2 8.71e- 2 0 <NA>
#> 18 18 0.534 5.34e- 1 1.07e- 1 4.27e- 2 6.41e- 2 0 <NA>
#> 19 19 0.393 3.93e- 1 7.86e- 2 3.15e- 2 4.72e- 2 0 <NA>
#> 20 20 0.289 2.89e- 1 5.79e- 2 2.31e- 2 3.47e- 2 0 <NA>
#> # … with abbreviated variable name ¹HandlingMortalitiesypr_plot_sr(population)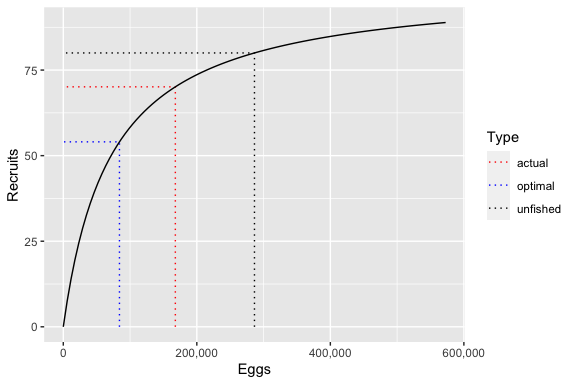
ypr_tabulate_sr(population)
#> # A tibble: 3 × 7
#>   Type        pi     u    Eggs Recruits Spawners Fecundity
#>   <chr>    <dbl> <dbl>   <dbl>    <dbl>    <dbl>     <dbl>
#> 1 unfished 0     0     286350.     80      159.      3600.
#> 2 actual   0.2   0.08  167831.     70.1    108.      3112.
#> 3 optimal 0.458 0.183 84129. 54.0 63.7 2641.ypr_tabulate_yield(population)
#> # A tibble: 2 × 8
#> Type pi u Yield Age Length Weight Effort
#> <chr> <dbl> <dbl> <dbl> <dbl> <dbl> <dbl> <dbl>
#> 1 actual 0.2 0.08 8.63 7.67 65.8 3112. 2.12
#> 2 optimal 0.458 0.183 11.7 6.87 62.6 2641. 5.82
ypr_plot_yield(population)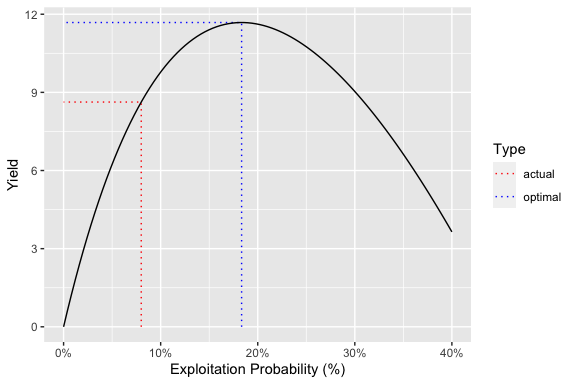
For more information see the Get Started vignette.
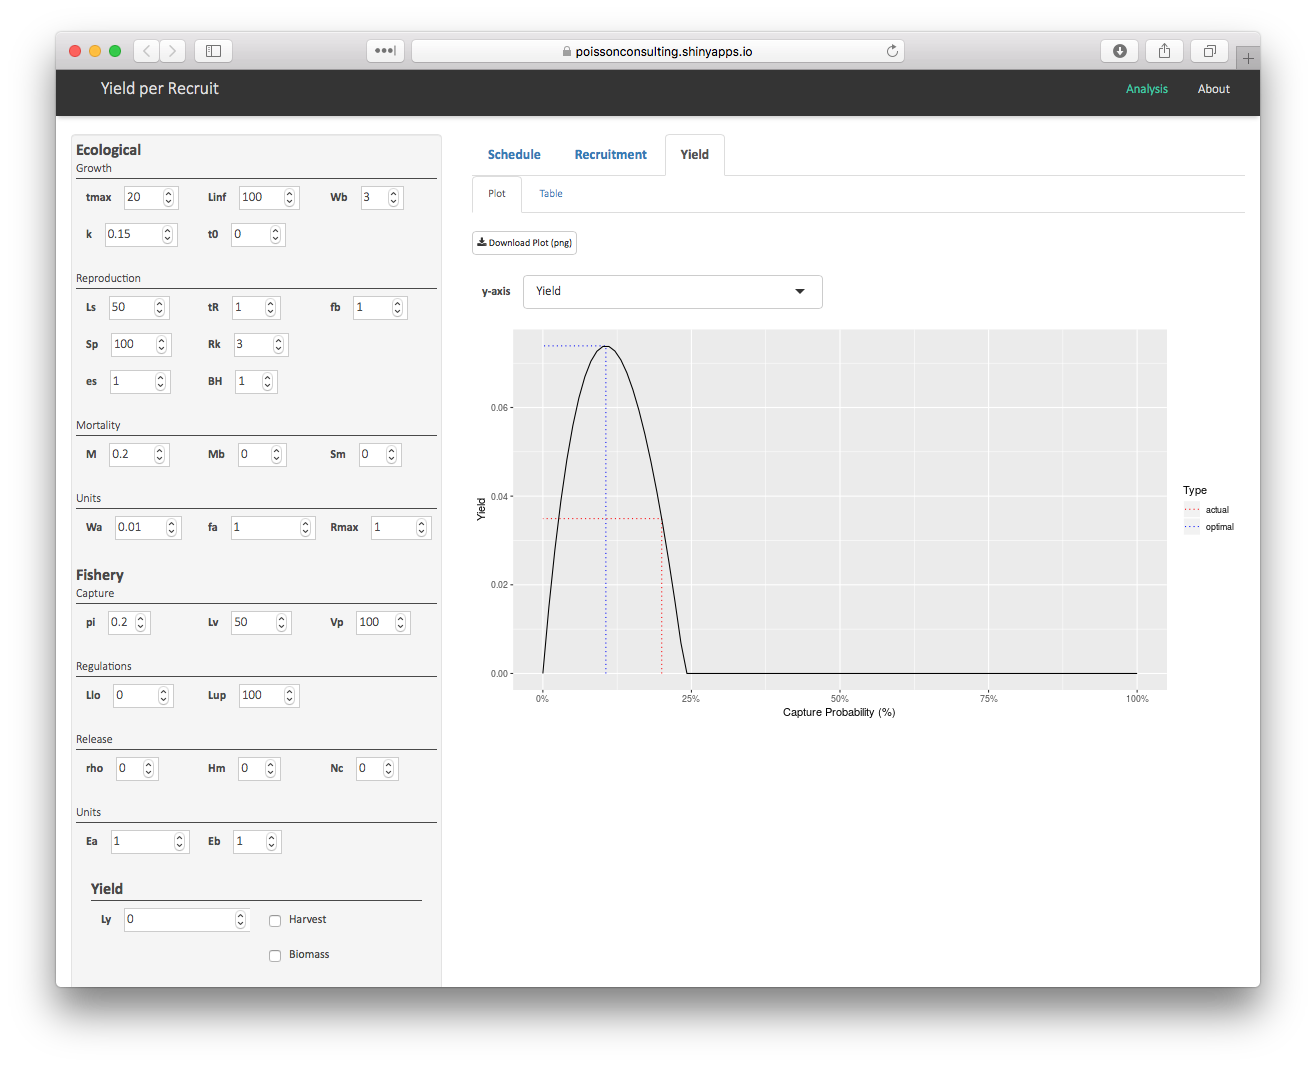
To interactively explore the effects of altering individual parameters on the schedule, stock-recruitment and yield see the ypr shiny app.
Development of ypr was partially supported by the Habitat Conservation Trust Foundation and the Ministry of Forests, Lands and Natural Resource Operations.
The hex was designed by The Forest.
Please report any issues.
Pull requests are always welcome.
Please note that the ypr project is released with a Contributor Code of Conduct. By contributing to this project, you agree to abide by its terms