I'am looking for examples showing that correlation does not imply causality, the targeted audience consists of undergraduate students (their first year at the university but in the BioMathStat track). All practicals are under R. If you still don't have R at hand, you can copy/paste the source code below in our RWeb server and then click on the submit button to reproduce the graphics.
This great example was pointed to me by Thomas Lumley from the University of Washington. The original dataset is here and its description there. Don't look at the original post on R-help diffusion list there because there is a hint inside.
fev <- read.table("http://pbil.univ-lyon1.fr/members/lobry/corcau/fev.txt")
names(fev) <-c("seqnbr","subjid","age","fev","height","sex","smoke")
smk <- fev[fev$smoke == 1, ] # smokers
nsmk <- fev[fev$smoke == 2, ] # non smoker
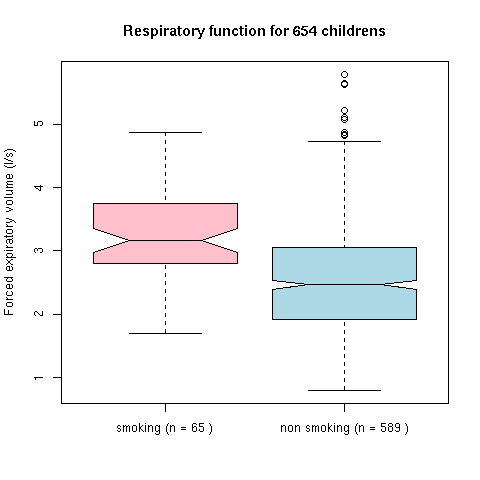
boxplot(fev$fev~fev$smoke, col = c("pink","lightblue"),
names = c(paste("smoking (n =", nrow(smk), ")"),
paste("non smoking (n =", nrow(nsmk), ")")),
notch = TRUE,
ylab = "Forced expiratory volume (l/s)",
main = paste("Respiratory function for", nrow(fev),"childrens"))
There is clearly a difference between the smoking and non-smoking group. Since the notches of the two boxplots do not overlap then, at a critical level of 5 %, we can reject the null hypothesis stating that the medians of the respiratory function are the same between the two groups. But but but ... wait a minute ... the results are better in the smoking group! I won't give here the solution of this apparently curious result, there are enough informations in this data set to understand what's going on. Smoking is of course not good for childrens, so why the smoking group has better respiratory results?
This example was pointed to me by Jill Caviglia-Harris from Salisbury University. The Super Bowls is a popular sport contest in the USA, based on American football. The Super Bowl theory correlates U.S.A. stock market performance to the results of the super bowls. This theory (Sommers 2000) states that: "When a team from the National Football Conference wins the Super Bowl, the stock market goes up, and when it doesn't, the stock market goes down. Usually, that is. Alas, the predictive power of this rule is on the decline and in a few years it may be down to zero. The author does not predict what the next spurious correlation will be."
sbt <- read.table("http://pbil.univ-lyon1.fr/members/lobry/corcau/sbt.txt")
sbt <- sbt[sbt$Year < 1999, ] # Don't look at all data
nfc  <- sbt[sbt$Conference == "NFC", ] # National Football Conference
nnfc <- sbt[sbt$Conference == "AFC", ] # Non National Football Conference

boxplot(sbt$Per~sbt$Conf, col = c("pink","lightblue"),
        names = c(paste("non NFC (n =", nrow(nnfc), ")"),
                 paste("NFC (n =", nrow(nfc), ")")),
        notch = TRUE,
        ylab = "Percentage Change in DJIA ",
        main = paste("Super bowls and stock markets (",
                      min(sbt$Year), "-", max(sbt$Year), ")" ))
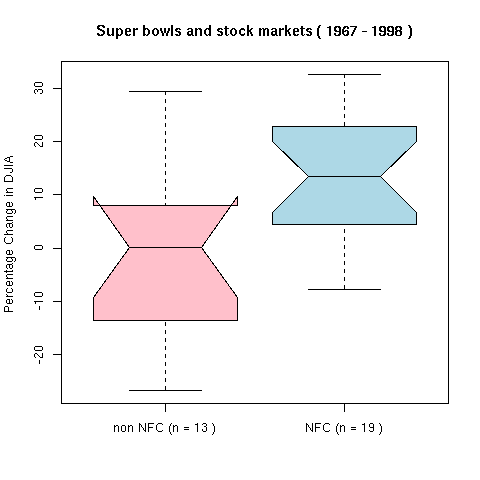
Arglll... Too bad! I loved this one too much! But it is not striking enough...
This dataset was posted by Albyn Jones from Reed College, in Portland, Oregon (USA) on R-help diffusion list. The expression "gun registration laws" refers to the fact that some USA states do not require mandatory licensing and registration of handguns. The gun registration indicator is taken from a USA Today article (Tuesday, January 7, 1992, PAGE 5A). The article reported that gun registration laws lead to increased numbers of homicides, a conclusion reached by comparing the mean number of homicides in states with gun registration laws to states without registration laws:
guns <- read.table("http://pbil.univ-lyon1.fr/members/lobry/corcau/guns.txt", header = TRUE)
grl  <- guns[guns$gunreg == 1, ] # States with gun registration laws
ngrl <- guns[guns$gunreg == 0, ] # States without gun registration laws
boxplot(guns$homicide~guns$gunreg, col = c("pink","lightblue"),
        notch = TRUE,
        ylab = "Homicide counts (log scale)",
        names = c(paste("No gun law (n =", nrow(ngrl), ")"),
                  paste("Gun law (n =", nrow(grl), ")")),
        main = paste("Homicides in", nrow(guns),"USA states"),
        log = "y")
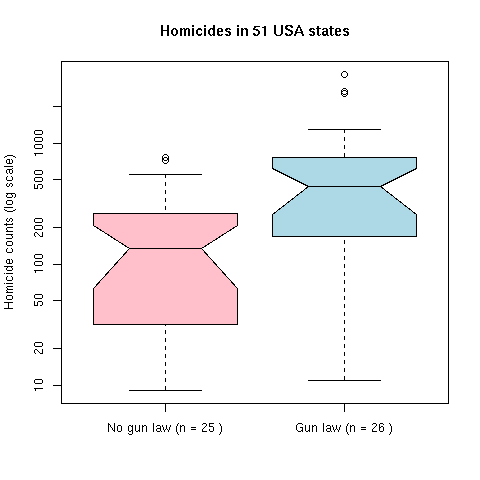
There is clearly a difference between the states with or without gun registration laws. Since the notches of the two boxplots do not overlap then, at a critical level of 5 %, we can reject the null hypothesis stating that the medians of homicide numbers are the same between the two groups. But but but ... wait a minute ... the results are better in the states without gun registration laws! Here again, there are enough informations in this data set to understand what's going on.
I have set up this one directly from R's standard dataset:
data(sunspots)
library(ts)
data(lynx)
spots <- window(sunspots, freq = 1, start = 1880, end = 1900)
lnx <- window(lynx, start = 1880, end = 1900)
ratio <- max(lnx)/max(spots)
par(mai = rep(1, 4))
plot(lnx, main = "Sun spots intensity\nand lynx population density",
     t = "b", ylab = "")
lines(ratio*spots, col = "red", t = "b")
axis(side = 4, col = "red", col.axis = "red", at = ratio*pretty(spots),
     lab = pretty(spots))
legend(1887, 4500, col = c("red", "black"), c("spots", "lynx"), pch = 21)
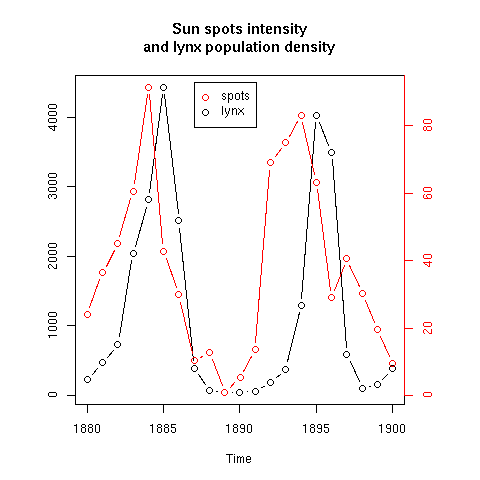
And the correlation vanishes when you consider all available data:
spots <- window(sunspots, freq = 1, start = 1821, end = 1934)
ratio <- max(lynx)/max(spots)
plot(lynx, main = "Sun spots intensity\nand lynx population density",
     ylab = "")
lines(ratio*spots, col = "red")
axis(side = 4, col = "red", col.axis = "red", at = ratio*pretty(spots),
    lab = pretty(spots))
mtext("Sun spots", adj = 1, col = "red")
mtext("Lynx", adj = 0)
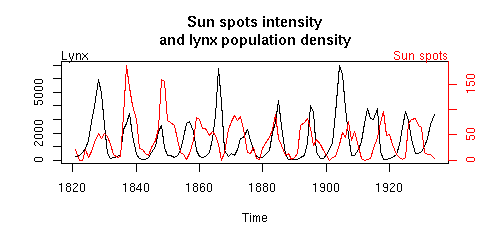
As pointed to me by Eric Rexstad from the University of Alaska Fairbanks, It turns out that this is not a very good example because the Lynx-sunspot relationship is a controversial issue (yes!). It was first put forward in: Elton, C. (1924) Br. J. Exp. Biol., 2:119-163 and rejected later by the same auhor in: Elton, C., Nicholson, M. (1942) J. Anim. Ecol., 11:215-244. However, using a new dataset about the past fluctuations of the main prey of the Lynx, Sinclair et al. (1993) Am. Nat.,141:173-198 do not rule out a possible indirect modulation by solar activity of the prey population dynamics (but see also Lindstrom et al. (1996) There is nothing new under the sunspots. Oikos, 77:565-568. Ranta et al. (1997) Solar activity and hare dynamics: a cross-continental comparison. Am. Nat.,149:765-775. Sinclair & Gosline (1997) Solar activity and mammal cycles in the Northern Hemisphere. Am. Nat.,149:776-784.) It is therefore advisable to avoid this example.
Pointed to me by Jason Turner, page 23 in Tufte's bible there is a graph showing correlation between solar radiation and the London Stock Exchange index. Failed to find the corresponding data set up to now.
Just found this link up to now. So, Paul Watzlawick is apparently at the origin of this one.
Pointed to me by Scott Milligan from McMaster University:
I seem to remember a tongue-in-cheek paper describing how weather
patterns in some South American country were used to accurately predict
fluctuations in the NYSE, but this morning I wasn¹t able to find it anywhere.
Nevertheless, you might be able to locate it. It was quite good.
I seem to remember a truely wonderful correlation done between the declining
stork population in Europe and the declining birth rate in these countries :-)
Spencer Graves posted on r-help:
George Box presented a beautiful plot that showed a high correlation
between stork sightings and the number of human babies born year by year
for several years in Oldenberg (Germany, I think).  I believe it appears
early in Box, Hunter and Hunter (1978) Statistics for Experimenters
(Wiley), but I don't have the book in my hand, so I can't confirm that
or give a page reference.
Posted to me by Patrick Connolly in reply to I don't know who:
|> Hi all:
|>
|> And then there's the classic case of higher frequency of cases with
|> coronary heart disease in Arizona than NYC.  Does that support the
|> hypothesis that cleaner air causes CHD or that those with CHD choose
|> Arizona for its cleaner air?

Before that came the relationship between the number of births in 19th
century Sweden which was 'evidently' caused by the increase in the
number of storks (which find human created environments convenient and
proliferated as the human population increased).

Looks like you can have some fun with this one.  I had a quick look
for a stork dataset and found this page
http://horizon.unc.edu/courses/292/schedule.asp
I found this ref: Steffen Wirth . (2003) King Kong, Storks and Birth Rates. Teaching Statistics 25: 1, 29-32. Looks interesting.
More information for the stork example were kindly send to me by Kevin Wright:
A link to a listserv here, with the following post:
Date:         Fri, 26 Nov 1999 12:15:14 +0000
Reply-To:     "R. Allan Reese" <[log in to unmask]>
Sender:       "National Birding Hotline Cooperative (Chat Line)"
              <[log in to unmask]>
From:         "R. Allan Reese" <[log in to unmask]>
Subject:      Storks and data - reference found
Content-Type: TEXT/PLAIN; charset=US-ASCII

The storks and babies correlation is based on annual counts made 1930-36
in Oldenburg, Germany. The data are discussed in

Glass, GV (1984) Statistical Methods in Education and Psychology
                 Prentice-Hall pp104-105
who quotes the data from
Box, GEP; Hunter WG & Hunter JS (1978) Statistics for Experimenters
                 John Wiley pp8-9
who in turn credit the data to
Ornithologische Monatsberichte, 44 No 2, Jahrgang, 1936, Berlin
         "                    , 48 No 1, Jahrgang, 1940, Berlin
Statistiches Jahrbuch Deutscher Gemeinden, 27-33, Jahrgang, 1932-1938,
Gustav Fischer, Jena.

The spurious correlation is ascribed to the increase in storks and
humans over the years.

R. Allan Reese                       Email: [log in to unmask]
Associate Manager                    Direct voice:   +44 1482 466845
Graduate Research Institute          Voice messages: +44 1482 466844
Hull University, Hull HU6 7RX, UK.   Fax:            +44 1482 466846
====================================================================
A link to a practical with this (Oldenburg, Germany) dataset:
Fertility_Enhancer	People
140	55.5
148	55.5
175	64.9
195	67.0
245	69.0
250	72.0
250	75.5
With Syvain Mousset, we have also used recently a stork example (with actual data) for an exam (in french).
Posted by Dirk Eddelbuettel on R-Help:
IIRC someone did a paper a few ago correlating "everything" in a OECD or
World Bank database of macroeconomic variables... and found something like
milk production in Indonesia to be a perfect predictor for subsequent SP500
returns.

The point was, of course, to show the fallacy in such 'data mining'.  I wish
I had the original reference.
![]() Back
to PBIL home page
Back
to PBIL home page