This page allows for the on-line reproduction of some results from the paper:
Perrière, G.,
Lobry, J.R.,
Thioulouse, J.
(1996)
Correspondence discriminant analysis: a multivariate method for comparing
classes of protein and nucleic acid sequences.
CABIOS,
12:519-524 (CABIOS is now Bioinformatics).
Abstract:
This report describes two applications of a multivariate
method for studying classes of nucleotide or protein
sequences, correspondence discriminant analysis (CDA). The
first example is the discrimination between Escherichia coli
proteins according to their subcellular location (membrane,
cytoplasm and periplasm). The high resolution of the method
made it possible to predict the subcellular location of
E.coli proteins for whom this information is not known. The
second example is discrimination between the coding
sequences of leading and lagging strands in four bacteria,
Mycoplasma genitalium, Haemophilus influenzae, E.coli and
Bacillus subtilis. The programs used for computing the
analysis are integrated in a publicly available package that
runs on MacOS 7.x or Windows 95 operating systems
(http://biomserv.univ-lyon1.fr/ADE-4.html). These programs
are also accessible through our World Wide Web server
(http://biomserv.univ-lyon1.fr/NetMul.html).
Protein data set
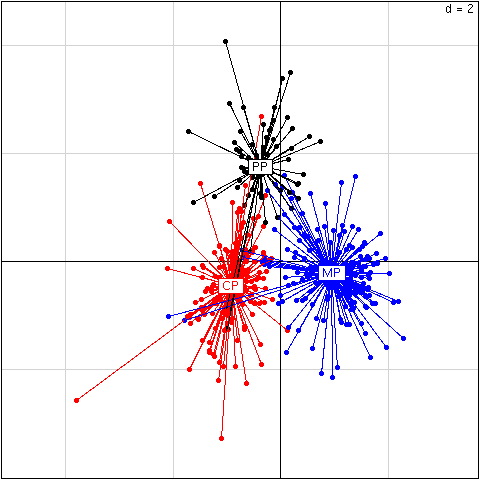
Figure 1
Factorial map of the the two discriminant axes of the analysis
on 413 E. coli proteins. Each protein is represented by a dot linked by
a line to the gravity center of the group it belongs to. The first axis
discriminates Membrane Proteins (MP) from Cytoplasmic Proteins (CP) and
Periplasmic Proteins (PP), while the second axis discriminates PP from CP and MP.
Table 1
Factor scores for the amino acids on the two axes of the discriminant
analysis on 413 E. coli proteins and example of protein factor
score computation.
Columns Ai1 and Ai2
contain the amino acid factor scores on the
two discriminant axes, Ni. contains the absolute amino acid
frequencies in the whole data set, and Nij (V4) contains the
absolute amino acid frequencies in protein AraJ (P23910).
The factor score of AraJ on the two axes of the analysis is
computed using equation (2), with N.. and N.j
respectively equal
to the sum of the Ni. and the Nij columns of the table. The
threshold value between MP/non-MP is equal to -0.024 and the
threshold value between PP/non-PP is equal to 0.617
              Ai1         Ai2    Ni. Nij   Ai1*Nij/Ni.   Ai2*Nij/Ni.
Arg -0.0224444307 -0.19632825   7694  11 -3.208848e-05 -2.806876e-04
Ala -0.0008848707 -0.07402600  16280  49 -2.663308e-06 -2.228055e-04
Gln  0.2282808512  0.49864634   6436   7  2.482856e-04  5.423437e-04
Cys -0.1147018450 -0.21666135   1399   5 -4.099423e-04 -7.743436e-04
Leu  0.2386590780 -0.26550447  17383  57  7.825788e-04 -8.706066e-04
Gly  0.2409532279 -0.15998687  13083  44  8.103602e-04 -5.380587e-04
His -0.4109746141 -0.06306444   3204   5 -6.413462e-04 -9.841517e-05
Phe  0.1555698783 -0.43662726   7576  29  5.955024e-04 -1.671356e-03
Ser  0.1349925385  0.56593170   9296  28  4.066040e-04  1.704614e-03
Val  0.2826027346  0.04519071  12549  28  6.305583e-04  1.008319e-04
Glu -0.7152045402 -1.45179243   8601   7 -5.820755e-04 -1.181554e-03
Ile  0.4126975144 -0.82137277  10392  28  1.111964e-03 -2.213091e-03
Thr  0.0830666145  0.03665992   8912  15  1.398114e-04  6.170319e-05
Lys -0.2080301637  1.50979787   7381  12 -3.382146e-04  2.454623e-03
Asp -0.8409564915 -0.23896277   7931   4 -4.241364e-04 -1.205209e-04
Met  0.2340209938  0.07286442   5122  22  1.005166e-03  3.129670e-04
Pro -0.2304634610  0.93564105   7066  14 -4.566216e-04  1.853803e-03
Asn  0.1506997535  0.33397438   6226  10  2.420491e-04  5.364189e-04
Tyr  0.1799142335 -0.29107730   4894  15  5.514331e-04 -8.921454e-04
Trp  0.2022029988  0.21669752   2774   4  2.915689e-04  3.124694e-04
Sum            NA          NA 164199 394  3.928794e-03 -9.838096e-04
Fjk            NA          NA     NA  NA  1.637320e+00 -4.100014e-01
Note that there is a problem here: the results are not exactly the same as
in the paper. The total number of amino-acids is 164,199 here versus
164,879 in the paper. 680 amino-acids have been lost somewhere.
Codon data set
Introduction
The data
in the Nucl folder are imported under R with
this script.
The correspondence discriminant analyses for the four species are run with
this script.
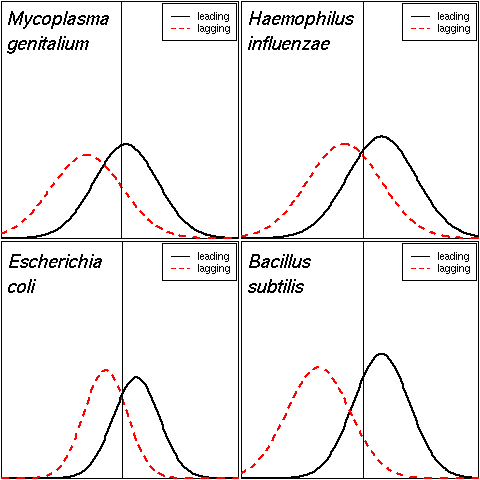
Figure 2
Distribution of the factor scores on the discriminant axis of the coding
sequences belonging to the leading and lagging groups.
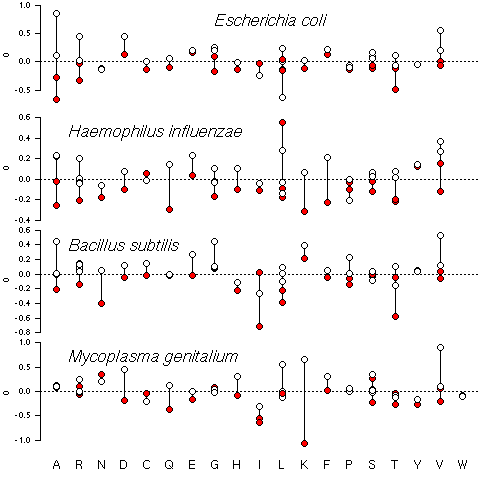
Figure 3
Discriminant power of codons. Each point represents the
discriminant score of one codon, a positive value means that
the codon is more frequent in leading than in lagging coding
sequences. Codons are grouped by amino acids according to
the one-letter code at the bottom of the figure. White dots
represent codons with a keto base (G or T) in their third
codon position, while red dots represents codons with
an amino base (A or C).
If you have any problems or comments, please contact
Jean Lobry.