This page allows for the on-line reproduction of the results in the paper: Thioulouse, J., Lobry, J.R. (1995) Co-inertia alaysis of amino-acid physico-chemical properties and protein composition with the ADE package. Computer Applications in the Biosciences, 11:321-329. [DATASET] [PubMed] [Preprint (PDF)] [Publisher]
Acknowledgements: We thank D. Chessel and C. Gautier for helpful comments on a first draft of the published manuscript. We thank Daniel Chessel for pointing out on june 2004 that the dataset published originally on the web (14-DEC-1994 at ftp://biom3.univ-lyon1.fr/pub/datasets/CABIOS95) didn't allowed for the reproduction of the results of the paper because of a wrong column order in one table (this point has been fixed now, see details). We thank Daniel Chessel for improving the algorithm for co-inertia: in the original paper it was stated that: "Improvements in the algorithm should provide computation times for co-inertia analysis comparable to those for PCA and CA: the matrix from which eigenvalues and eigenvectors are computed will be of dimension min(n, p, q), with n = number of observations, p = number of variables in the first table, q = number of variables in the second table (instead of min(p, q) as is now the case)." This is no more the case, just to give a striking benchmark our original work involved computation times that were in hours for now in seconds. Moore's law for a 10 year lag is no sufficient to explain this. Thanks Daniel (see more on this in french there).
Abstract: A multivariate analysis method called co-inertia analysis was used to determine the main relationships between two data tables having identical rows. This method is available in the ADE multivariate analysis package for Macintosh micro-computers. It was applied to two data sets, one containing the amino-acid composition of 999 E. coli proteins, and the other the values of 402 physico- chemical properties for the 20 natural amino-acids. There were strong relationships between amino-acid physico-chemical properties and the composition of proteins. The first common factor was hydrophobicity; it is linked to the biological environment of proteins, either in the cytoplasm (or outside the cell), or in the nonpolar environment of the phospholipid bilayer of biological membranes. The second factor linked the expressivity of protein genes and the propensity of amino-acids to form alpha helix/beta sheets. The third factor showed that heavy, aromatic amino-acids tend to be avoided, except when they are needed for structural or functional reasons. These results are discussed in terms of selective pressure acting on amino-acid composition of proteins.
Note: This web page wasn't created at the same time as the original paper submission in 1994, it's more a re-creation, produced more than 10 years later (in july 2006), than a pure reproducibility claim. Anyway, data and methods are here under the GPL, you can play with both. Share and enjoy!
Importing data is done thereafter by sourcing the readdata.R file.
Co-inertia analysis is done by sourcing the computations.R file.
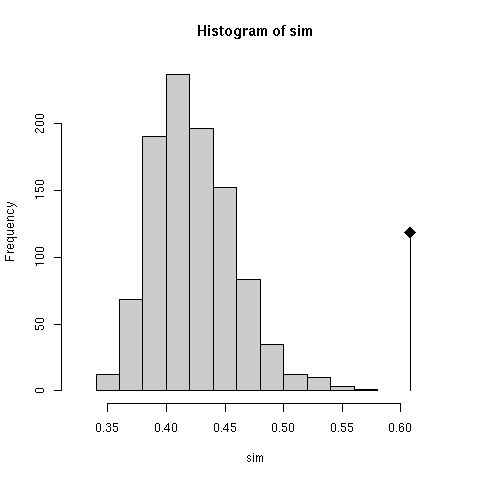
The null hypothesis is that the two tables are independent. The test checks that the observed value (0.6081122) of the RV coefficient ( Escoufier 1973) is much higher than what would be observed at random. Radomness is obtained here by permuting the rows of one table and computing the co-inertia again. This is performed many times so as to have an idea of the distrubution of the RV coefficient (the results were reported in Figure 2 of the original paper in terms of total co-inertia instead of RV).
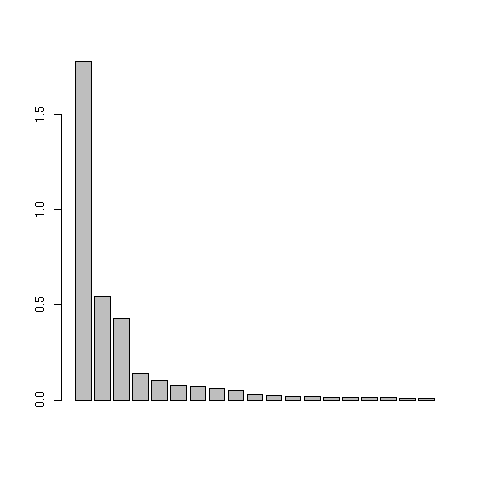
This was figure 3 in the original paper. The first three eigenvalues are obviously greater than the following ones. Starting from the fourth eigenvalue, the values slowly decrease without any marked variations, showing that the rest of the structure can be discarded. These first three eigenvalues acounts for 81% of the total variability (52%, 16%, and 13% respectively).
This was figure 4 in the original paper. This graph is a collection of 20 elementary graphs, all at the same scale, corresponding to the 20 amino-acids. Each elementary graph, shows the F1 x F2 factor map (F1 is on the x-axis and F2 on the y-axis), with, for each protein, a square whose size is proportional to the centered relative frequency of the corresponding amino-acid in the protein. Black is for positive value, white for negative values.
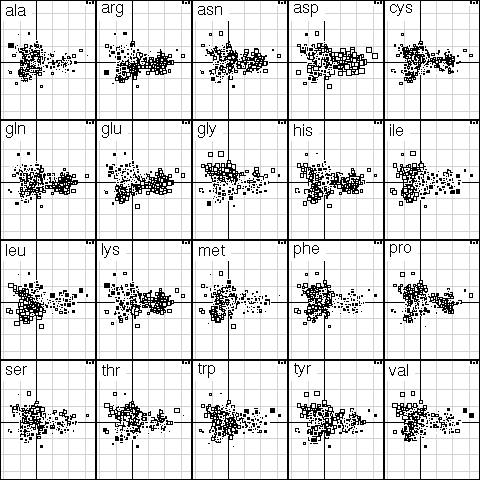
Table 1 in the original paper was giving the 20 most important proteins for defining the first three factors of the co-inertia analysis. Here is the way to find the protein names in this table:
Table 2 in the original paper was giving the 20 most important amino-acid indices for defining the first three factors of the co-inertia analysis. Here is the way to find the amino-acid indices in this table:
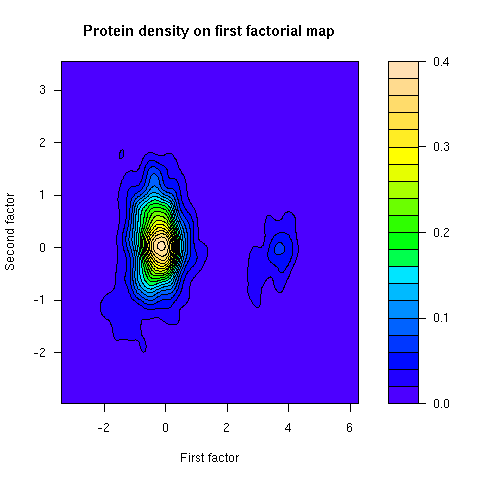
This figure was not in the paper. The density of proteins on the first factorial map of co-inertia analysis shows that there are two groups of proteins. The smallest group corresponds to integral membrane proteins.
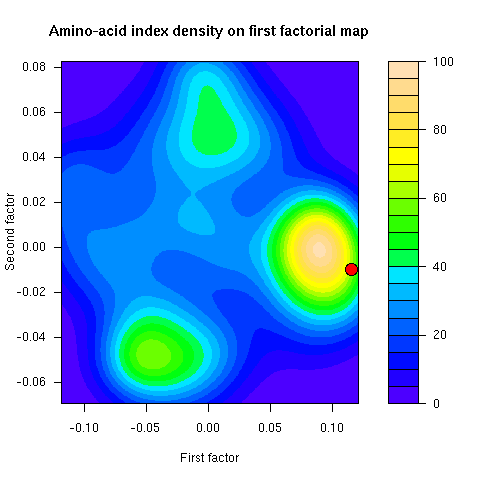
This figure was not in the paper. This is the density of amino-acid indices on the first factorial map of co-inertia analysis. The famous Kyte and Doolittle hydropathy index (KYTJ820101 entry in the aaindex database) location on this map is given by the red dot.